Introduction
Health sector programs often have important policy objectives relating to the reduction of unfair health inequality, as well as the improvement of total population health. Health inequality reduction objectives are particularly common in public health decision-making, for example, in relation to screening and vaccination programs, and are sometimes also relevant to decisions regarding the introduction and delivery of new medicines, surgical procedures, and other health technologies.
Standard economic evaluation methods, however, focus solely on identifying cost-effective interventions to maximize health. The distributional cost-effectiveness analysis (DCEA) framework described in this article builds on standard cost-effectiveness methods by extending them to incorporate distributional impacts on health. Like the standard cost-effectiveness analysis (CEA) framework, this framework focuses exclusively on health benefits and opportunity costs falling on the health sector budget. It focuses on the health impacts of health sector programs, assuming that there are no important impacts on the distribution of income, education, or other determinants of health outside the health sector. It is therefore not suitable for evaluating cross-government public health program with important nonhealth benefits and opportunity costs falling outside the health sector budget.
The key steps in the DCEA framework outlined below are: estimating the baseline health distribution in the general population; modeling changes to this baseline distribution due to the health interventions being compared, and using this to estimate the mean change in health due to each intervention; adjusting the resulting modeled distributions for alternative social value judgments regarding fair and unfair sources of health variation; using these adjusted distributions to estimate the change in the level of unfair inequality due to each intervention; and finally combining the mean level of health and level of unfair inequality associated with each intervention by using an appropriately specified social welfare function to rank interventions, and decide as to which best fulfills the dual objectives of maximizing health and minimizing unfair health inequality.
Estimating The Baseline Health Distribution
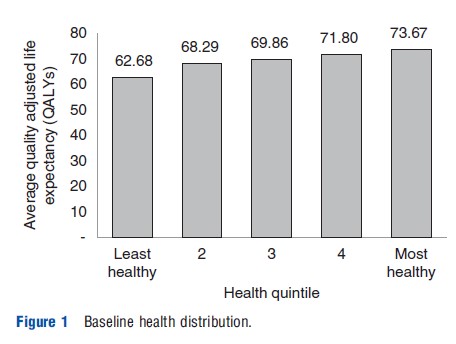
The first step in DCEA is describing the baseline distribution of health in the general population, taking into account variation in both quantity and quality of life among different subgroups in the population as defined by relevant population characteristics. A natural health metric to use in this context is quality adjusted life expectancy (QALE) at birth, though other suitable health metrics can be used – such as disability adjusted life expectancy at birth or age-specific QALE – so long as they are on an interpersonally comparable ratio scale suitable for use within CEA. Mortality rates and morbidity adjustments differentiated by relevant population characteristics are required to estimate this distribution. Figure 1 shows the estimated baseline population health distribution in the UK in the year 2010 as measured in QALE at birth, taking into account differential mortality and morbidity by age, gender, and area level deprivation.
Estimating The Distribution Of Health Changes Due To The Intervention
The next step in DCEA is to estimate the net impact of one or more interventions on the baseline distribution of health within the general population. This requires not only ‘effectiveness’ information on the direct health benefits of the health intervention on individuals receiving the intervention, but also information on the indirect health impacts of the intervention – in particular, the health opportunity costs due to displaced expenditure within the health sector budget – on both recipients and nonrecipients of the intervention. There are a number of factors that may vary by relevant population subgroup characteristics, which must be incorporated into the model to estimate correctly the impact of a health intervention on the population health distribution, including:
- Prevalence and incidence of the health condition, which will also help to analyze the differing maximum potential impact that the intervention could have on each population subgroup.
- Uptake of the intervention, which for more complex interventions may include differential uptake by subgroup at multiple stages of the patient pathway.
- Effectiveness of the intervention.
- Mortality and morbidity due to condition and comorbidities.
- Opportunity cost.
Under the assumption of a fixed overall health budget, any additional costs associated with the intervention will result in some displacement of activity. The distribution of the health opportunity costs due to this displacement on both recipients and nonrecipients of the intervention in the population needs to be characterized by subgroup to give the overall distribution of health losses due to the intervention. A simple and convenient assumption is that the distribution is neutral – i.e., all subgroups share equally in the health opportunity cost of displaced health sector activity. However, this assumption may not be accurate, and ideally, one would want evidence on the likely distribution of health opportunity cost.
Once the distribution of health gains and health opportunity costs of an intervention for each population subgroup have been estimated, these distributions can be combined to produce a distribution of net health changes by subgroup and applied to the baseline health distribution to give an estimate of the impact of the intervention on the overall health distribution.
Measuring The Level Of Inequality In The Estimated Health Distributions
The overall health distributions associated with each intervention can be assessed in terms of the level of health inequality they comprise. There are a number of commonly used indices for measuring inequality in the distribution of income, which can also be applied to health when measured on a ratio scale such as quality adjusted life expectancy. These indices are based on a common set of fundamental principles:
- Principle of transfers: The most universally recognized concept of what is meant by inequality in a distribution is the weak principle of transfers, also known as the Pigou–Dalton transfer principle. It broadly states that the transfer of health from a more healthy to a less healthy person reduces inequality so long as the amount of health transferred is less than the difference in health between them. It is of course not possible directly to transfer current health from one person to another (except in rare cases such as organ transplant); but one can think of indirect transfers in terms of gains or losses in people’s expected future lifetime experience of health. This concept of inequality is useful for comparing alternative distributions of a fixed total pot of health. The next two concepts discuss how inequality measures react to a change in the size of the pot.
- Scale independence: Scale independence focuses attention on concern for relative inequality between individuals – their ‘fair shares’ of the total pot – rather than the size or scale of absolute differences between individuals. It states that any equal proportional change in each individual’s level of health should not change the measure of health inequality. Although this is relatively uncontroversial when applied to changes in the scale used to measure health, it is harder to justify when looking at real differences in health. A commonly used tool to describe relative inequality in a distribution is the Lorenz curve, this plots the cumulative proportion of individuals ordered by their health on the x axis against their cumulative share of total health on the y axis. The difference between the Lorenz curve and the 451 line of equality represents the level of relative inequality in the distribution. Common relative inequality measures such as the Gini coefficient are based on measuring this difference. There are also relative inequality measures such as the Atkinson index that allow for the specification of a level of inequality aversion to adjust the sensitivity of the measure to inequalities in different parts of the distribution, and which also allow explicit formulation of tradeoffs with sum total health within a social welfare function framework.
- Translation independence: Translation independence focuses on concern for absolute inequality between individuals. It states that any equal absolute change in each individual’s level of health should not change the measure of health inequality. Simple measures such as absolute gaps and slope indices are widely used to quantify absolute inequality. There are also absolute inequality measures such as the Kolm index – an absolute inequality equivalent to the Atkinson index – which allow the specification of an absolute inequality aversion parameter and the modeling of explicit tradeoffs with sum total health.
Although all reasonable inequality measures satisfy the principle of transfers, a measure cannot fully satisfy both scale independence and translation independence. For example, if everyone in a health distribution gains 25 years in life span the absolute gap between any two individuals remains the same, a relative gap between two individuals living 60 and 50 years respectively of 20%, however, declines into a relative gap of only 13%, with these individuals living 85 and 75 years after the gain in life span. When selecting inequality indices to rank distributions, it is important to recognize these distinctions and identify those that most closely represent the concept of inequality of relevance in the context of the decision being evaluated.
Adjusting For Social Value Judgments Regarding Fair And Unfair Sources Of Inequality
The purpose of DCEA is to identify the health intervention that results in the best improvement in both average health and unfair health inequality in the population. The distributions of health estimated thus far represent all variation in health in the population. However, some variation in health may be deemed ‘fair’ or, at least ‘not unfair,’ perhaps because it is due to individual choice or unavoidable bad luck. The health distributions should therefore be adjusted to include only any health variation that is deemed ‘unfair’ before measuring the level of inequality. The DCEA framework allows multiple sources of unfair health inequality – for example, by income, education, ethnicity, geography, and other factors – to be analyzed in the same model. If decision makers are interested in one particular source of unfair health inequality, this can also be analyzed separately, or by decomposing the influence of this factor on overall unfair inequality. To make these adjustments for unfair sources of health variation, the association between relevant population characteristics and the estimated health distributions must be modeled. Social value judgments then need to be made regarding whether or not health variation associated with each of the population characteristics is deemed fair. The modeled associations combined with these social value judgments are used to isolate unfair variation in the distribution, using either the methods of direct or indirect standardization. Inequality measures can then be used to assess the level of unfair inequality in the estimated health distributions associated with each health intervention and hence to rank health interventions by their impact on minimizing this inequality.
Social Welfare Functions And Distributional Dominance
Once both the mean level of health and the fairness adjusted distribution of health associated with each of the interventions have been estimated, social welfare functions (SWF) can be used to compare interventions. Several properties are considered useful when constructing a SWF. In describing these properties, one can use the terminology hiA to represent the health of individual i in health distribution A, Ui to represent an individual utility function for individual i, and W to represent social welfare:
- Individualistic: This means the SWF is a function of the individual utilities, i.e., the SWF has the form: W = W(U1, U2…, Un).
- Nondecreasing: This states that if every individual has at least as good health in distribution A as in distribution B, then overall distribution A is at least as good as distribution B.
- Additive: This means that the social welfare function can be written as a sum of the individual utility functions, i.e., the SWF has the form: W(h1, h2,…, hn) = U1(h1) + U2(h2) + … + Un(hn).
- Symmetric: This means that the SWF treats individual utilities anonymously, i.e., the SWF has the form: W = W(U1, U2,…, Un) = W(U2, U1,…, Un) = … = W(Un, U2,…, U1).
- Concave: This means that when evaluating changes to social welfare lower weight is applied to increases in health to those with higher health than to those with lower health, where the welfare weight is defined as: U`(hi) = dU(hi)/dhi.
These properties can be used to derive rules to help determine which of two health distributions are preferable. By using these dominance rules, the exact nature of the SWF need not be specified but can instead be described by broad characteristics that encompass whole classes of SWFs, under any of which the welfare rankings of particular interventions would be the same. The following rules are listed in order from least restrictive to most restrictive that allow a partial ordering of health distributions:
- Rule 1 – Pareto Dominance: For any individualistic, increasing and additive SWF, if hiA ≥hiB for all i and hiA>hiB for at least one i, then distribution A is preferred to distribution B, where subscript i represents the same individual in each distribution.
- Rule 2 – Reranked Pareto Dominance: If additionally, the SWF is also symmetric, then the same condition applies, only that now subscript i represents the individual with equivalent health ranking in each distribution rather than necessarily the same individual in both distributions.
- Rule 3a – Atkinson’s Theorem: If additionally, the SWF is strictly concave and distributions A and B have equal mean health, then distribution A is preferred to distribution B if, and only if, the Lorenz curve for distribution A lies wholly inside the Lorenz curve for distribution B.
- Rule 3b – Shorrocks’ Theorem: if Lorenz curves cross and the mean health in distribution A is greater than that in distribution B, then distribution A is preferred to distribution B if, and only if, the generalized Lorenz curve for distribution A lies wholly inside the generalized Lorenz curve for distribution B, where the generalized Lorenz curve is derived by multiplying the Lorenz curve for the distribution by the mean of the distribution.
These dominance rules may be used to rank the estimated distributions associated with the health interventions being compared and hence to rank the interventions in terms of social welfare. These rules do not, however, allow for trading off between health inequality and overall health and hence will only provide a partial ranking of interventions when rankings on these two objectives do not coincide.
Social Welfare Indices
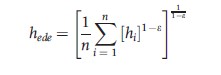
Where interventions cannot be ranked based on distributional dominance rules, the SWF needs to be fully specified by defining the nature of the inequality aversion that it will embody to create social welfare indices. The principle underlying the interpretation of these indices is that if health is distributed unequally then, given an aversion to inequality, more overall health would be required to produce the same level of social welfare than if health were distributed equally. Social welfare is represented in these measures using the concept of ‘equally distributed equivalent’ health: the common level of health in a hypothetical equal distribution of health that results in the same level of social welfare as the actual unequal distribution of health. Two common alternatives specifications for the nature of inequality aversion expressed in social welfare indices are constant relative and constant absolute levels of inequality aversion, yielding the Atkinson and Kolm indices of social welfare respectively:
- Constant relative inequality aversion: This means that a constant proportionate change in health results in a constant proportionate change in welfare weight, i.e., function U(.) takes the form:
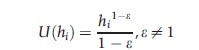
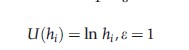
Summing across this population gives the Atkinson index of social welfare:
where the parameter ε, which can take any value from zero to infinity, specifies the level of societal inequality aversion.
The higher the e, the further the index tilts toward concern for health improvement among less healthy individuals rather than more healthy individuals. A value of zero represents a classic ‘utilitarian’ view that all that matters is sum total health and not inequality in the distribution of health. Although as the value approaches infinity, the index comes to represent the ‘maximin’ view that all that matters is the health of the least healthy individual, irrespective of the health of all other individuals. The proportion of mean health that can be sacrificed to achieve equality will increase as the level of inequality aversion rises.
- Constant absolute inequality aversion: This means that a constant absolute change in health results in a constant proportionate change in welfare weight, i.e., function U(.) takes the form:
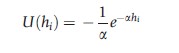
Summing across the population, this gives the Kolm leftist index of social welfare:
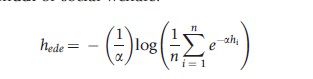
where the parameter a specifies the level of societal inequality aversion, with higher a values making the index more sensitive to changes at the lower end of the health distribution. The value of this index represents the absolute amount by which average health could be reduced to achieve equal health for all. As with the Atkinson index, the amount of mean health that could be sacrificed to achieve an equal distribution rises with the level of inequality aversion.
The ranking of health distributions using social welfare indices will always be consistent with that produced by the distributional dominance rules where these apply. Where distributional dominance does not apply, rankings may be sensitive to the type and level of inequality aversion embodied by the SWF and these should be chosen with care.
Comparing And Ranking Interventions
Having fully specified the SWF, all interventions can be compared and ranked on the combined objectives of maximizing health and minimizing unfair health inequalities in the population. Conclusions on which intervention is best may be sensitive to alternative social value judgments made both in the fairness adjustment process and in the specification of the type and level of inequality aversion. These social value judgments should ideally be made by the appropriate stakeholders through a deliberative decision-making process, and the robustness of conclusions to alternative plausible social value judgments should be explored.
Conclusion
DCEA is a framework for incorporating equity concerns into the standard methods of CEA. A number of social value judgments regarding which inequalities are deemed to be unfair and the nature and strength of inequality aversion need to be made when using the framework to evaluate and rank alternative health interventions. The framework makes these social value judgements explicit and transparent, and lends itself well to checking the sensitivity of conclusions drawn to alternative plausible social value judgments.
There are a number of alternative methods proposed in the literature for including health inequality concerns in economic evaluation. These typically involve either weighting health gains differently for different groups in the population or weighting overall health gains directly against overall changes in heath inequality. Both these types of method can be replicated using the DCEA framework by imposing the relevant restrictions on the fairness adjustment process and on the form and parameters of the social welfare function.
An important emerging source of empirical literature on incorporating health inequality impacts into economic evaluation in low and middle income countries is the ‘ex- tended cost-effectiveness analysis’ work being developed by Dean Jamieson, Ramanan Laxminarayan, and colleagues as part of the Disease Control Priorities 3 project (www.dcp-3.org). Their approach to distributional analysis is similar in spirit to the approach outlined in this article, although simplifying the analysis by (1) focusing on a single distributional variable (wealth quintile group) rather than analyzing multiple distributional variables, (2) setting aside the issue of opportunity costs falling on the health budget by assuming that the intervention is funded by the tax system, and (3) presenting results as a disaggregated ‘dashboard’ of costs and consequences by social group rather than using inequality indices and social welfare functions to analyze tradeoffs between improving health and reducing unfair health inequality explicitly. However, their approach takes a broader perspective than standard CEA by incorporating financial risk protection benefits as well as health benefits. It therefore points the way toward the next great methodological challenge in this area: developing methods of ‘distributional cost-consequence analysis’ and ‘distributional cost-benefit analysis’ for incorporating health inequality impacts into economic evaluation of cross-government interventions with important nonhealth benefits and opportunity costs.
Bibliography:
- Adler, M. (2012). Well-being and fair distribution: Beyond cost-benefit analysis. New York: Oxford University Press.
- Atkinson, A. B. (1970). On the measurement of inequality. Journal of Economic Theory 2(3), 244–263.
- Cowell, F. (2011). Measuring inequality, 3rd ed. Oxford University Press.
- Culyer, A. J. and Wagstaff, A. (1993). Equity and equality in health and health care. Journal of Health Economics 12(4), 431–457.
- Dolan, P. and Tsuchiya, A. (2009). The social welfare function and individual responsibility: Some theoretical issues and empirical evidence. Journal of Health Economics 28(1), 210–220.
- Fleurbaey, M. and Schokkaert, E. (2009). Unfair inequalities in health and health care. Journal of Health Economics 28(1), 73–90.
- Kolm, S. C. (1976). Unequal inequalities. I. Journal of Economic Theory 12(3), 416–442.
- O’Donnell, O., Van Doorslaer, E., Wagstaff, A. and Lindelow, M. (2008). Analysing health equity using household survey data: A guide to techniques and their implementation. Washington, DC: World Bank.
- Roemer, J. E. (1998). Theories of distributive justice. Cambridge, MA: Harvard University Press.
- Sen, A. K. (1973). On economic inequality. Oxford, UK: Oxford University Press. Sen, A. K. (2002). Why health equity? Health Economics 11(8), 659–666.
- Shorrocks, A. F. (1983). Ranking income distributions. Economica 50(197), 3–17.
- Verguet, S., Laxminarayan, R., Jamison, D. (2012). Universal public finance of tuberculosis treatment in India: An extended cost-effectiveness analysis. Disease control priorities in developing countries, 3rd ed. Working Paper No. 1. Available at: https://pubmed.ncbi.nlm.nih.gov/24497185/.
- Wagstaff, A. (1991). QALYs and the equity-efficiency trade-off. Journal of Health Economics 10(1), 21–41.
- Williams, A. (1997). Intergenerational equity: An exploration of the ‘fair innings’ argument. Health Economics 6(2), 117–132.
- Williams, A. and Cookson, R. (2000). Equity in health. In Culyer, A. J. and Newhouse, J. P. (eds.) Handbook of health economics, ch. 35, vol. 1, pp. 1863–1910. Amsterdam: Elsevier.
- Williams, A. and Cookson, R. A. (2006). Equity-efficiency trade-offs in health technology assessment. International Journal of Technology Assessment in Health Care 22(1), 1–9.