Introduction
The first recorded mathematical model describing a communicable disease was constructed by the Swiss mathematician Daniel Bernoulli and read at the Royal Academy of Sciences in Paris in 1760. His model aimed to evaluate the impact on human life expectancy at birth if smallpox were to be eliminated as a cause of death through the use of variolation: the practice of deliberately infecting individuals with a mild form of smallpox in order to induce immunity to the disease. Bernoulli’s work was used to inform the sale of annuities and so had an immediate economic impact.
The model constructed by Bernoulli assumed that the instantaneous probability of infection, or force of infection, remained constant over time and so was, what is now termed, a static model. This approach to infectious disease modeling, using a static force of infection, remained the norm in modeling for cost-effectiveness analysis until the turn of the twenty-first century.
Dynamic epidemiological modeling of communicable disease transmission started in 1906, when William Hamer, working on childhood infections including measles, postulated that the course of an epidemic depends on the rate of contact between susceptible and infectious individuals, defining the so-called ‘mass action’ principle of transmission for directly transmitted viral and bacterial infections. In doing so, he removed the assumption of a static force of infection and laid the foundations of modern transmission modeling.
In 1908, Hamer’s initial discrete-time model was translated into a continuous time framework by Ronald Ross, who received the Nobel Prize in 1902 for identifying mosquitoes as the vector transmitting malaria. His work was further developed by Kermack and McKendrick, who, in 1927, recognized that a threshold population density was required before an epidemic could take place. The critical elements were now in place for the development of the models used today.
The first landmark textbook on mathematical modeling of epidemiological systems was published by Norman T. Bailey in 1975 and led to the recognition of the importance of epidemiological modeling in public health decision making.
There were, however, still two separate disciplines informing public health policymaking: health economics and epidemiology. Policymakers inevitably have to make decisions about fair and efficient allocation of limited resources and, as such, economic modeling, and cost-effectiveness models in particular, are of critical importance. Unfortunately, when analyzing interventions that targeted communicable diseases, most cost-effectiveness models were static in nature and ignored the developments in dynamic modeling that flowed from the foundations outlined above. At the same time, dynamic transmission models largely ignored the economic aspects of disease control.
The first model to bring these two schools together was published in 1994 by Rowley and Anderson and sought to model the impact and cost-effectiveness of HIV prevention efforts.
Over the past 20 years the fields of dynamic communicable disease modeling and cost-effectiveness modeling have developed rapidly and, when combined, are an indispensable tool used to inform health technology assessments and the formulation of public health policy to control these diseases.
This article is aimed at health economists, who would like an introduction to dynamic infectious disease modeling.
Communicable diseases are each caused by a pathogen, transmitted from one individual to another in whom they may or may not cause clinical symptoms. Such pathogens are typically bacteria (Salmonella), viruses (influenza), fungi (Aspergillus), protozoa (malaria), or prions (bovine spongiform encephalopathy) and exhibit a wide range of natural histories.
The specific details of the biological interaction between a pathogen and its host are fundamental to its epidemiology at the population level. The site of infection may influence the route of transmission, examples being direct airborne transmission between individuals, contaminative transmission via the fecal–oral route, or sexual transmission.
The site of infection also influences the host’s ability to mount an effective immune response. Replication within sites that are not easily reached by the immune system is one way that pathogens, such as the herpes viruses responsible for cold sores, genital herpes, chicken pox, and shingles, can remain latent for decades. Such ‘immunologically privileged’ sites include cells of the nervous system and to a lesser degree the external mucosal surfaces in the nose. The latter are exploited by the numerous rhinoviruses that collectively cause the common cold.
So what are the key features that set communicable diseases apart from noncommunicable conditions such as heart disease and why do they need special consideration in economic analyses? To illustrate some of these features, the rest of this article will focus on directly transmitted airborne infections.
Direct Airborne Transmission
With directly transmitted airborne pathogens, the hosts typically experience a period of immunological naıvety before they first become infected (Figure 1). This naıve period is typically measured in years. Such susceptible individuals may then become infected, after which there is a delay before becoming infectious, while the pathogen replicates to sufficiently high levels. These exposed, but as yet not infectious, individuals are said to be latently infected and may remain so for days (influenza) to years (tuberculosis), depending on the pathogen. A distinction should be noted between this latent period and an incubation period, the latter being the time from infection to the development of clinical symptoms. An individual may remain infectious for days (rhinovirus) to years (tuberculosis). A proportion of those infected may die; those that survive either remain infected or recover, often with the development of pathogen specific immunity that typically lasts for decades.
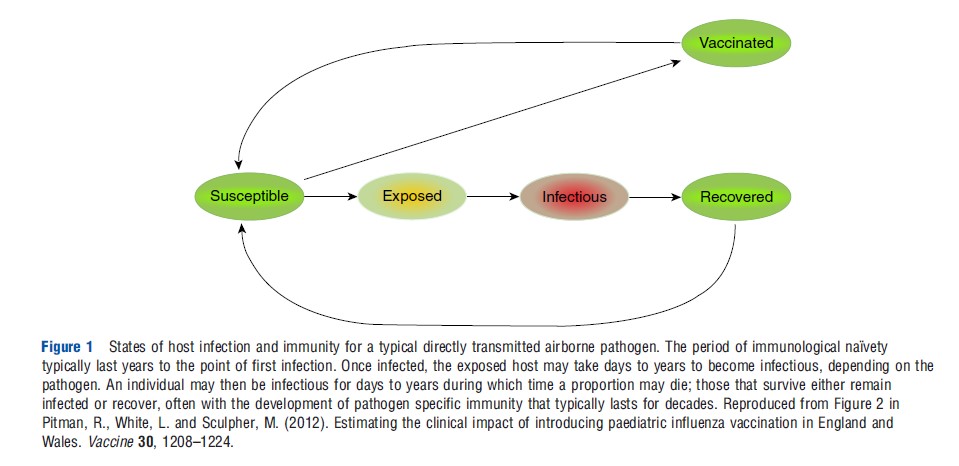
The rate at which individuals transition from one state to another dictates the dynamic pattern of temporal change in the prevalence and incidence of infection in a population.
Pathogen transmission is dependent on both biological factors, as described in the Section Introduction, and on the behavior of the host. Host behavior will influence the probability of a susceptible and an infectious individual coming into contact, whereas pathogen and host biology dictate the probability of such a contact resulting in the successful transmission of the pathogen.
The probability of meeting an infectious individual is in part dependent on the number of infectious individuals in the community, a number that is likely to change over time as susceptible individuals are infected and in turn become infectious, recover, or die. This feedback in the risk of infection is a key characteristic of communicable diseases and one of the principal features that distinguishes them from noncommunicable diseases. Feedback produces nonlinear interactions allowing the possibility for small interventions to have large, possibly counterintuitive outcomes and for different pathogens to exhibit a rich diversity of dynamic patterns of infection.
The basic reproductive number (R0) is a pivotal concept in infectious disease epidemiology, and is defined as the number of secondary infectious cases arising from an average primary infectious case, in a totally susceptible population. In other words, if you start with a population in which no one is immune to a particular infection and a single infectious individual is introduced, how many people will they infect who themselves go on to become infectious.
Processes that drive the transmission dynamics of infectious diseases can be broadly divided into those factors which allow a disease to invade a population and those that enable it to persist there.
When an infection is introduced into an entirely susceptible population the occurrence, or not, of an epidemic depends on the basic reproductive number (R0). If R0 is greater than 1 then the number of infections can increase and an epidemic may ensue. If it is less than 1, then the infection is destined to die out.
Directly transmitted infections that induce long-lasting immunity in those that recover are responsible for many of the classic epidemics, characterized by a wave of cases. The chance of any one individual becoming infected will change over the course of such an epidemic wave. At the start, with an entirely susceptible population, any encounter with a newly arrived infectious case has the potential to result in transmission of the infection. The spread of the infection is therefore initially dependent on there being sufficient encounters which, on average, result in transmission, such that R0 is greater than 1. This is easier to achieve in large, dense populations.
As the wave of infection sweeps through the population, infected individuals recover and are immune to further infection. As the proportion of immune individuals in a population increases, a diminishing percentage of people encountered by infectious cases will be susceptible to infection. As the epidemic wave reaches its peak, the average number of secondary infections per infectious individual falls to 1. As the population is no longer fully susceptible, this measure is known as the effective reproductive number (R). Ongoing transmission continues to deplete the susceptible pool, such that R falls below 1 and the number of infectious hosts starts to decline (Figure 2). If the number of infectious individuals is not to continue to decline, the pool of susceptibles must be replenished sufficiently quickly to maintain R at or above 1. This may be via the birth of new individuals, immigration, and the waning of acquired immunity over time. Persistence of an infection (endemicity) is therefore more likely in populations with high birth rates. Conversely, many common infections are absent from small isolated communities as birth rates are too low to supply new susceptibles sufficiently quickly for these infections to remain endemic.
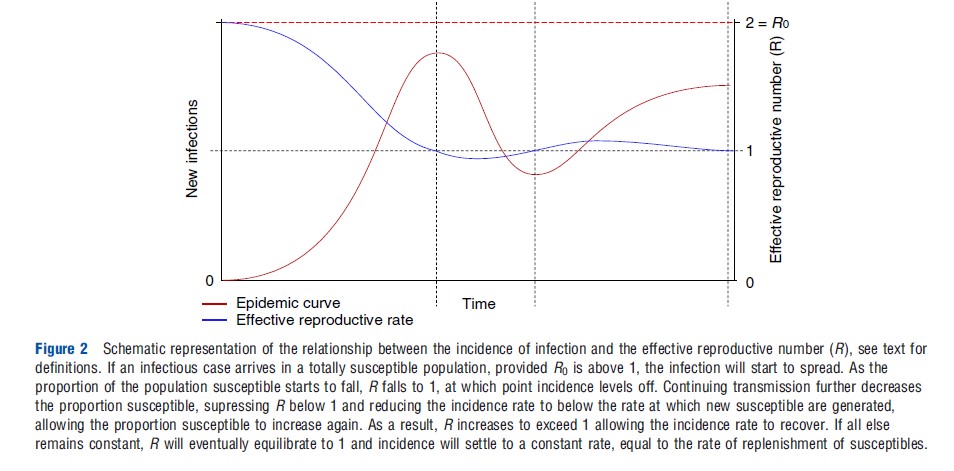
Provided there is sufficient replenishment of susceptibles and all external factors remain constant, the number of infections will settle to a stable endemic state at a constant prevalence that corresponds to an effective reproductive number equal to 1. A consequence of this is that the proportion of the population that is naturally immune will also settle to a constant value that crucially is less than 100%. This is sometimes referred to as the critical proportion immune. Should the number of infections rise for any reason then infectious cases will be generated at a faster rate resulting in an increase in the proportion immune and a decline in the number of susceptibles, which will in turn down regulate the rate of infection, bringing the prevalence of infections back down to its equilibrium state. The converse is true should the number of infections fall.
Vaccination
The aim of vaccination is firstly to protect the vaccinee against infection; however, given sufficiently high uptake, vaccination also benefits the wider, unvaccinated population. This is a consequence of immunized individuals blocking chains of transmission sufficiently often to reduce the number of new infectious individuals produced by each infectious case. Vaccination, therefore, reduces the probability of encountering an infectious individual, thereby helping to protect the whole population. This population-wide protection is known as herd immunity and is the reason an infection may be eliminated from a population without having to vaccinate everyone.
Vaccination that immunizes a proportion of the population may also affect the temporal dynamics of an infection. This may be observed when a program that utilizes a new vaccine is first introduced into a population (Figure 3). Before the introduction of vaccination, immunity is naturally acquired by infection. When a vaccination program is introduced, vaccinederived immunity supplements this preexisting naturally acquired immunity; the proportion immune now exceeds the equilibrium critical proportion leading to a fall in the incidence of infection and a decline in prevalence. With fewer infectious individuals to transmit the pathogen, the proportion of the population with naturally acquired immunity falls, reducing the overall proportion protected back down to below the critical proportion. This reduction in the proportion immune allows the rate of infection to increase again, leading to a partial rebound in the numbers infected and restoration of the critical proportion immune. The resulting transient low prevalence following program initiation is a well-recognized phenomenon known as the honeymoon period.
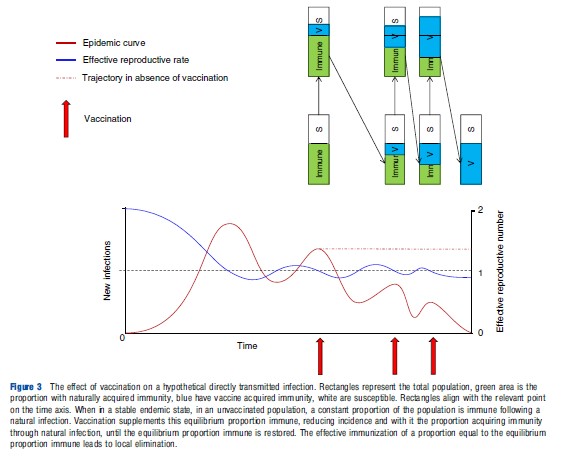
Should a sufficiently large proportion of the population be vaccinated to account for the entire critical proportion, then local elimination of a pathogen may be achieved. Consequently, the critical proportion immune is also known as the critical proportion to vaccinate (Vc). In a randomly mixing (homogeneous) population, this is defined as Vc = 1-1/R0.
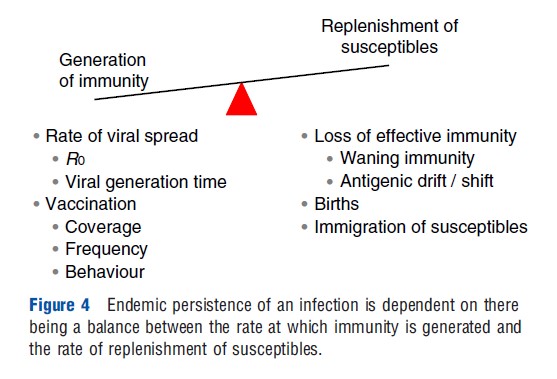
Endemic persistence of an infection within a population is therefore dependent on the balance between the generation of immunity, resulting either from pathogen spread or from vaccination, and replenishment of susceptibles as a result of the loss of effective immunity, births, and immigration (Figure 4).
An Example Transmission Model
One way to simulate the flow of individuals between each of the stages of infection and immunity outlined above is to compartmentalize the population into corresponding subgroups (susceptible, exposed, infectious, recovered, and vaccinated). Movement between these compartments, including the dynamics of viral transmission, progression, and recovery, may then be described by the following set of linked differential equations, for a = 0, 1, 2, …, 100 years of age:
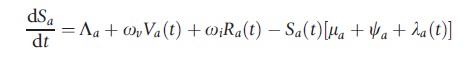
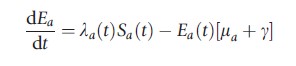
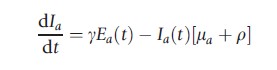
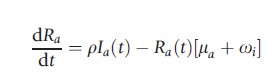
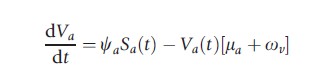
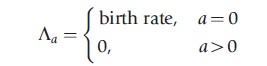
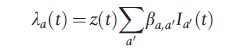
where ωv and ωi are the rate of loss of vaccine induced and naturally acquired immunity, respectively. The natural death rate is given by μa, the average latent period by 1/g, and the mean duration of infectiousness as 1/r. The age-dependent vaccination rate is signified by ψa and λa(t) represents the age-dependent force of infection in the model:
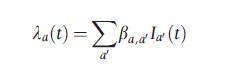
where βa,a` is the transmission coefficient describing the rate of contact and per contact probability of transmission from individuals of age a` to those of age a and
To arrive at an expression for R0, first note that the incidence of infection at age a (ζa(t)) is a function of both the force of infection and prevalence of susceptible hosts of age a:
![]()
This may be written in the form
![]()
Now consider the simplified situation where age is ignored and the population assumed to mix homogeneously. Recalling the definition of R0 as the number of secondary infectious hosts arising from one primary infectious host, in an entirely susceptible population:
![]()
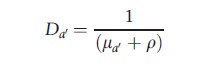
where N is the total population size. The basic reproductive number may now be expressed in the following form:
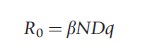
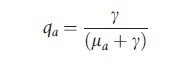
where D is the duration of infectiousness and q is the proportion of infections that become infectious. Note that for the model outlined above
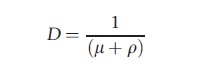
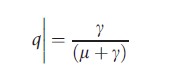
This expression of R0 may be adapted to give the number of infectious hosts of a particular age, arising from infectious individuals of the same or a different age and is usually expressed in matrix form, using the same notation Ra,a` as for βa,a` above:
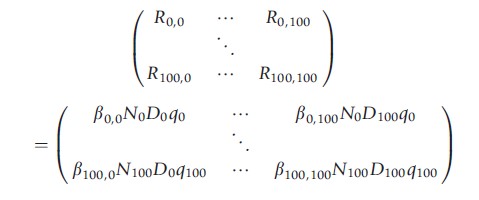
This matrix is known as the ‘next generation matrix,’ M, in which
The basic reproductive number for an age structured population may be calculated as the dominant eigenvalue of the next generation matrix, that is to say it is equal to the largest value of R0 that satisfies the following equation:
![]()
where I is the identity matrix.
Toward Further Realism
All models are, to a greater or lesser degree, caricatures of the real world. To be useful, such caricatures need to capture the essential details of the system being modeled. Models should therefore only be as complex as is required to address the question being asked. Unnecessary complexity reduces the transparency of a model and increases the number of parameters that must be estimated, each of which bringing with it its own uncertainty. The unnecessary proliferation of parameters also makes it harder to decide which model best fits any observed data that may be available. A model should therefore also only be as complex as can be supported by the available data.
Additional complexity may be justified, for example, where certain subgroups of the population need to be accounted for, such as the important risk groups that have a strong influence on the transmission dynamics of a pathogen or where certain types of behavior are similarly important. An example of the latter is the willingness of different subgroups to be vaccinated.
In temperate climates, certain directly transmitted infections, such as influenza, show a strong seasonal variation in incidence, tending to circulate more easily during the winter months. Although the precise reasons for this remain unclear, low temperatures that extend the time exhaled droplets take to evaporate and increased periods of time spent in poorly ventilated congregate settings have both been implicated.
One way to capture such phenomena is to utilize a periodic function such as a sine wave to emulate the seasonal fluctuation in the force of infection. Using the same notation as employed in the example model above, the force of infection may now be expressed in the following way:
where z(t) is the sine wave function;
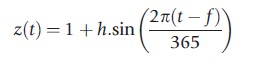
t being the number of days since the start of the simulation, whereas h controls the amplitude, and f the phase of the wave.
Choice Of Model
The population-based approach to modeling communicable diseases, outlined above, is the method of choice when dealing with common infections, transmitted in large populations. In these circumstances it is a set of population averages that are being modeled and numbers are sufficiently large that they are not significantly affected by chance variations at the individual level. However, where populations are small or an infection is rare, such as at the very start or end of an epidemic, these chance, or stochastic, variations may have a profound effect on the course of events. Epidemics may fail to take off or may simply burn out due to chance. In these circumstances, individual-based models should be used.
Individual or agent-based models simulate each person in a population, recording for each of them their current state with regards to age, infection, immunity etc. Such models are well suited for simulating stochastic events and can capture a greater level of population heterogeneity than can population models; however, this flexibility comes at a cost. When used to simulate even moderately large populations, they have a high computational overhead necessitating the use of high-performance computers with memory capacity measured in terabytes. Consequently, it is often not possible for such models to simulate transmission over more than a single year, which has implications for the time horizon of an analysis.
Burden Of Disease
Once an individual is infected, numerous factors may influence whether or not they develop disease, such as their age, physical fitness, and the presence of any comorbidities. The relationship between age and morbidity is of particular importance, as any change in the probability of infection can have an impact on the average age at which individuals first become infected. Widespread vaccination can reduce the prevalence of infection in a population and with it, the probability of encountering an infectious individual, leading to an increase in the average age of first infection. Very young babies may benefit from such a shift, as they are often at an increased risk of more serious disease; however, more perverse outcomes are also possible. If the average age of infection moves into the childbearing ages, this can have disastrous consequences with pathogens such as rubella, where the pathogen poses a significant risk if contracted during pregnancy. In such cases, high levels of vaccine coverage in the wider population must be maintained to produce a net reduction in the risk of morbidity in vulnerable age groups. Alternatively, vulnerable age groups can be targeted for vaccination.
To move from a model of infection incidence to one that captures disease burden, the age stratified probabilities of developing disease, given infection, need to be estimated by dividing the incidence of disease outcome by the incidence of infection, over a defined period of time. Disease outcomes of interest may include primary care consultations, outpatient visits, hospitalizations and death.
Cost-Effectiveness Analysis
Once the dynamic aspects of transmission have been accounted for, the cost-effectiveness analysis of interventions that target communicable diseases is conducted in much the same way as for any other intervention. There are, however, a few areas in which special consideration is required, particularly with regard to the time horizon of the analysis and the implementation of discounting.
Economic analyses recognize the fact that individuals prefer to receive the benefits of an intervention immediately and to defer the costs incurred till later. Such ‘time preference’ is the reason for discounting future costs and benefits, but can raise difficult questions when applied to public health interventions such as vaccination program that target communicable diseases. Such programs typically incur large upfront costs but accrue benefits over a much longer time scale.
As an example, certain strains of human papillomavirus (HPV) can cause genital warts relatively soon after infection, whereas other strains can induce cervical cancer typically decades later. Applying a standard discounting approach to the cost-effectiveness analysis of HPV vaccination, where costs and benefits receive equal discounting, would only account for the benefits of preventing genital warts, a condition that is relatively easily treated. The lifesaving benefits of preventing cervical cancer would be largely discounted away. Such considerations have led to a widespread debate over the most appropriate approach to discounting, a debate that is as yet unresolved. The reason for this indecision lies more in the lack of information on social attitudes to the value of public health interventions of this nature than in the technical challenges of constructing an appropriate model formulation.
A related challenge concerns the choice of time horizon: how far into the future should costs and benefits be counted in a cost-effectiveness analysis. Again, the upfront costs and deferred benefits of vaccination raise an issue. With an ongoing vaccination program, any choice of time horizon will result in those individuals being vaccinated toward the end of the simulation accruing all of the costs associated with vaccination, but none of the benefits.
One solution is to extend the time horizon to the point where discounting renders further increases in costs and benefits insignificant. However, this approach is still problematic in circumstances such as those described above for HPV vaccination, where benefits accrue decades after vaccination. The uncertainty in projecting transmission dynamics so far into the future is also a potential hindrance to this approach.
Despite these challenges, numerous successful cost-effectiveness analyses have been conducted on interventions targeting communicable diseases, including vaccines to prevent influenza, pneumococcal disease, HPV, meningococcal group C (MenC), and varicella-zoster.
Growing interest in this field has also led to the publication of guidelines covering various aspects of communicable disease modeling.
References:
- Bailey, N. T. J. (1975). The mathematical theory of infectious diseases and its application, 2nd ed. New York: Hafner.
- Bartlett, M. (1949). Some evolutionary stochastic processes. Journal of the Royal Statistical Society. Series B (Methodological) 11, 211–229.
- Hamer, W. (1928). Epidemiology old and new. London. Kegan Paul.
- Kermack, W. O. and McKendrick, A. G. (1927). A contribution to the mathematical theory of epidemics. Proceedings of Royal Society 115, 700–721.
- Ross, R. (1916). An application of the theory of probabilities to the study of a priori pathometry. Part I. Proceedings of the Royal Society A: Mathematical, Physical and Engineering Sciences 92(638), 204–226, doi:10.1098/ rspa.1916.0007.
- Ross, R. and Hudson, H. P. (1917a). An application of the theory of probabilities to the study of a priori pathometry. Part II. Proceedings of the Royal Society A: Mathematical, Physical and Engineering Sciences 93(650), 212, doi:10.1098/ rspa.1917.0014.
- Ross, R. and Hudson, H. P. (1917b). An Application of the theory of probabilities to the study of a priori pathometry. Part III. Proceedings of the Royal Society B: Biological Sciences 89(621), 507, doi:10.1098/rspb.1917.0008.
- Rowley, J. T. and Anderson, R. M. (1994). Modeling the impact and costeffectiveness of HIV prevention efforts. AIDS 8, 539–548.
- Anderson, R. and May, R. (1991). Infectious diseases of humans: Dynamics and control. Oxford, New York, Tokyo: Oxford University Press.
- Anderson, R. M. and May, R. M. (1979). Population biology of infectious diseases: Part I. Nature 280, 361–367.
- May, R. M. and Anderson, R. M. (1979). Population biology of infectious diseases: Part II. Nature 280, 455–461.
- Porta, M. and Last, J. M. (2008). A dictionary of epidemiology, 5th ed. Oxford, New York: Oxford University Press.
- Vynnycky, E. and White, R. (2010). An introduction to infectious disease modelling. Oxford, New York: Oxford University Press.
- Beutels, P., et al. (2002). Economic evaluation of vaccination programmes: A consensus statement focusing on viral hepatitis. Pharmacoeconomics 20, 1–7.
- Jit, M. and Brisson, M. (2011). Modelling the epidemiology of infectious diseases for decision analysis: A primer. Pharmacoeconomics 29, 371–386.
- Pitman, R., Fisman, D., Zaric, G. S., et al. (2012). Dynamic transmission modeling: A report of the ISPOR-SMDM Modeling Good Research Practices Task Force Working Group-5. Medical Decision Making 32, 712–721.
- Walker, D. G., Hutubessy, R. and Beutels, P. (2010). WHO guide for standardisation of economic evaluations of immunization programmes. Vaccine 28, 2356–2359.
- Bilcke, J., Beutels, P., Brisson, M. and Jit, M. (2011). Accounting for methodological, structural, and parameter uncertainty in decision-analytic models: A practical guide. Medical Decision Making 31, 675–692.
- Bos, J. M., Beutels, P., Annemans, L. and Postma, M. J. (2004). Valuing prevention through economic evaluation: Some considerations regarding the choice of discount model for health effects with focus on infectious diseases. Pharmacoeconomics 22, 1171–1179.
- Brisson, M. and Edmunds, W. J. (2003). Economic evaluation of vaccination programs: The impact of herd-immunity. Medical Decision Making 23, 76–82.
- Brisson, M. and Edmunds, W. J. (2006). Impact of model, methodological, and parameter uncertainty in the economic analysis of vaccination programs. Medical Decision Making 26, 434–446.
- Melegaro, A., Jit, M., Gay, N., Zagheni, E. and Edmunds, W. J. (2011). What types of contacts are important for the spread of infections?: Using contact survey data to explore European mixing patterns. Epidemics 3, 143–151.
- Mossong, J., et al. (2008). Social contacts and mixing patterns relevant to the spread of infectious diseases. PLoS Medicine 5, e74.
- Westra, T. A., et al. (2012). On discounting of health gains from human papillomavirus vaccination: Effects of different approaches. Value Health 15, 562–567.
- Baguelin, M., Jit, M., Miller, E. and Edmunds, W. J. (2012). Health and economic impact of the seasonal influenza vaccination programme in England. Vaccine 30, 3459–3462.
- Brisson, M., de Velde, N. V., Wals, P. D. and Boily, M.-C. (2007). The potential cost-effectiveness of prophylactic human papillomavirus vaccines in Canada. Vaccine 25, 5399–5408.
- Choi, Y. H., Jit, M., Flasche, S., Gay, N. and Miller, E. (2012). Mathematical modelling long-term effects of replacing Prevnar7 with Prevnar13 on invasive pneumococcal diseases in England and Wales. PLoS One 7, e39927.
- Effelterre, T. V., et al. (2010). A dynamic model of pneumococcal infection in the United States: Implications for prevention through vaccination. Vaccine 28, 3650–3660.
- Jit, M., Chapman, R., Hughes, O. and Choi, Y. H. (2011). Comparing bivalent and quadrivalent human papillomavirus vaccines: Economic evaluation based on transmission model. British Medical Journal 343, d5775.
- Melegaro, A., et al. (2010). Dynamic models of pneumococcal carriage and the impact of the Heptavalent Pneumococcal Conjugate Vaccine on invasive pneumococcal disease. BMC Infectious Disease 10, 90.
- Pitman, R., White, L. and Sculpher, M. (2012). Estimating the clinical impact of introducing paediatric influenza vaccination in England and Wales. Vaccine 30, 1208–1224.
- Pitman, R. J., Nagy, L. D. and Sculpher, M. J. (2013). Cost-effectiveness of childhood influenza vaccination in England and Wales: Results from a dynamic transmission model. Vaccine 31, 927–942.
- Vynnycky, E., Pitman, R., Siddiqui, R., Gay, N. and Edmunds, W. J. (2008). Estimating the impact of childhood influenza vaccination programmes in England and Wales. Vaccine 26, 5321–5330.
- Wright, T. C., et al. (2006). Chapter 30: HPV vaccines and screening in the prevention of cervical cancer; conclusions from a 2006 workshop of international experts. Vaccine 24(supplement 3), S251–S261.