The nursing workforce in the US is comprised of both professional nurses and nonprofessional workers. Professional nurses typically complete nursing education in a hospital-based diploma program, community college or university and are registered and licensed by the state to practice nursing. Professional nurses also include advanced practice nurses (APRNs) who are registered nurses (RNs) that have completed graduate education and practice as nurse practitioners (NPs), certified nurse midwives (CRNMs), clinical nurse specialists (CNS’s), and certified nurse anesthetists. Nonprofessional nurses receive their nursing education in technical and vocational programs and are licensed by states as practical or vocational nurses. Supporting professional and nonprofessional nurses are assistive personnel, such as aides, orderlies, and personal care attendants, who have not completed formal education in nursing.
For several reasons, this article focuses on professional nurses. First, there is more complete data on RNs versus either practical or vocational nurses or the various personnel who assist nurses. Because RNs’ educational preparation and legal scope of practice enable them to perform more complicated nursing services, RNs have a greater impact on the productivity of the nursing workforce, earn higher wages, and exert a greater effect on healthcare spending, quality of care, and patient safety. And, because APRNs can legally provide many of the services traditionally provided by physicians, these nurses have become a highly visible component of the professional nursing workforce.
The article begins with an overview of the key demographic, educational, and employment characteristics of RNs and then briefly summarizes the forces that affect their demand and supply. Following this, the authors examine the ‘cyclical’ nature of RN shortages, describe the impact of the recent recessions on hospital RN employment, and identify key issues facing the RN workforce. The article concludes with a discussion of the characteristics and challenges faced by APRNs.
Data for the tables and figures shown in this article are derived from two sources. Data to estimate RN employment growth and the age composition of the nursing workforce were derived from the US Bureau of the Census Current Population Survey (CPS) Outgoing Rotation Group Annual Merged Files. The CPS is a household-based, nationally representative survey of more than 100 000 individuals administered monthly by the Bureau of the Census. This data source is used extensively by the Department of Labor to estimate current trends in unemployment, employment, and earnings and has been used to estimate employment trends for RNs and project the age and supply of RNs and physicians (Auerbach et al., 2007; Staiger et al., 2009). The CPS survey contains information on roughly 3000 RNs employed in nursing each year.
The second source of data comes from the National Sample Survey of RNs (NSSRNs) conducted by the Health Resources and Services Administration (HRSA). The NSSRN is the most well-known and comprehensive source of data on individuals who have active licenses to practice in the US as RNs whether or not they are actually employed in nursing. The surveys have been conducted every 4 years from 1977 to 2008 and provide information on the number of RNs; their educational background and areas of clinical specialty; employment settings; positions; salaries; geographic distribution; and personal characteristics including gender, racial/ethnic background, age, and family status.
Key Characteristics Of The Registered Nurse Workforce
Employment And Earnings
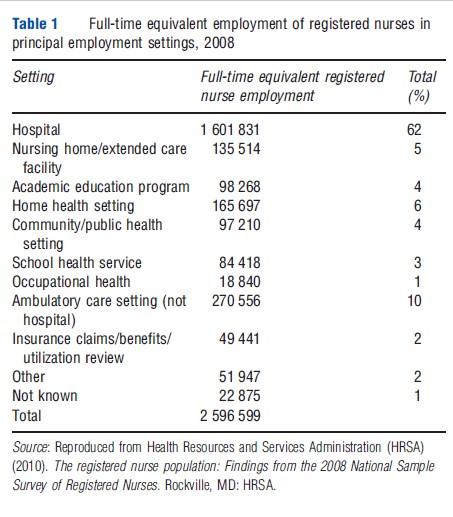
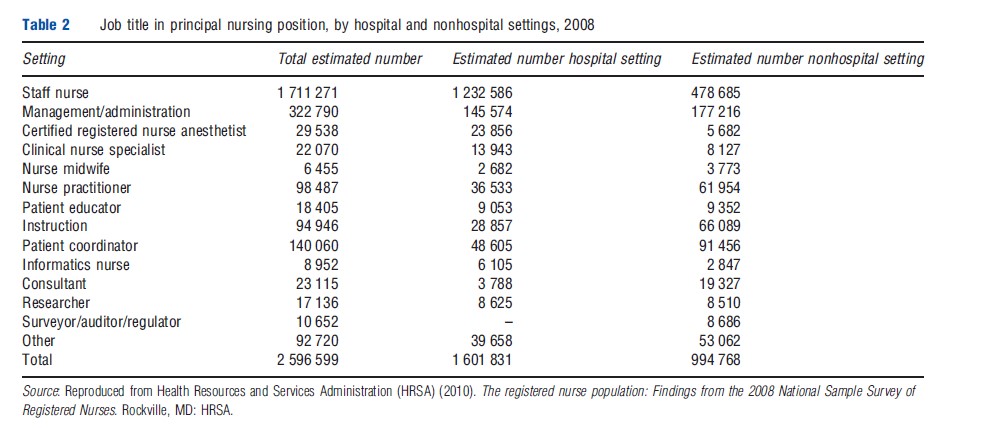
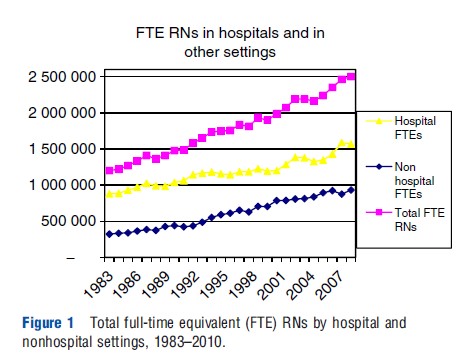
As shown in Table 1, RNs are employed in a variety of settings, including hospitals, extended care facilities, ambulatory care clinics, schools, public and community healthcare clinics, insurance companies, and others. Hospitals employ more than 60% of RNs, with the majority working on general medical and surgical care units, critical care and step-down units, emergency departments, and hospital-based outpatient surgery and ambulatory care centers. Not surprisingly, RNs work in many different clinical and nonclinical positions both in hospitals and nonhospital settings (Table 2). Over the past few decades, data from the CPS (Figure 1) indicate that RN employment on an FTE basis has grown faster in nonhospital settings than in hospitals.
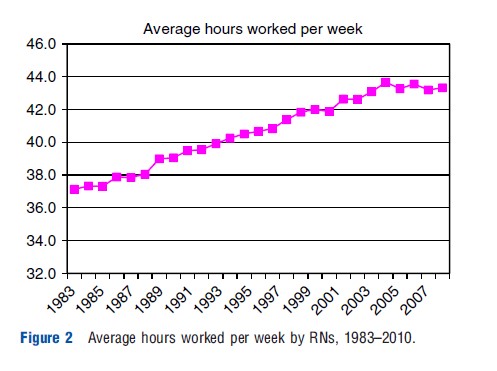
Over the past several decades, the average number of weekly hours worked by RNs has been increasing. According to the CPS, the average number of hours worked by RNs during a given week increased by 2 h from 34.7 h in 1983 to 36.7 h in 2010 (Figure 2).
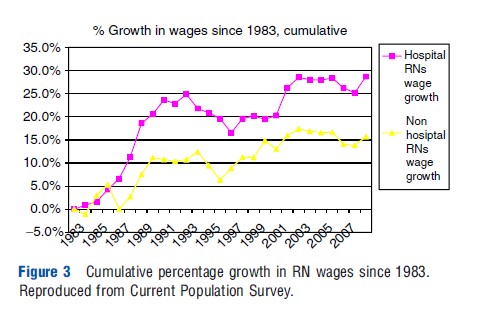
Using data on hourly earnings from the CPS, real (inflation adjusted) wages, for all RNs, increased 25% from 1983 to 2010. Increases in annual RN earnings were not gradual, however, as most of this increase occurred between 1983 and 1992 (Figure 3). From 1992 to 2000, real earnings stagnated or even dipped in some years, which suggests that excess capacity (too many RNs) may have existed in the nurse labor market during this period, perhaps as a result of the spread of managed care during the 1990s. During the last decade, real earnings among all RNs have increased less remarkably.
Demographics
Although the racial and gender composition of the nursing profession has become gradually more diverse, in 2010 the vast majority of RNs were women (91%) and white (78%). RNs whose initial nursing education took place outside the US or in the US territories also contribute substantially to the RN workforce in the US. According to the HRSA (2010), internationally educated nurses (IENs) have grown as a percent of the US nursing workforce, increasing from 5.1% in 2004 to 8.1% in 2008. The dominant source country of the IEN workforce is the Philippines (50%), followed by Canada at nearly 12%.
Age
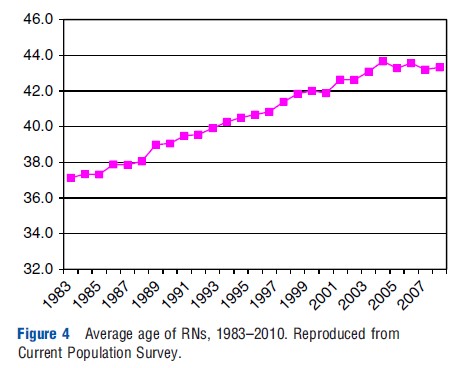
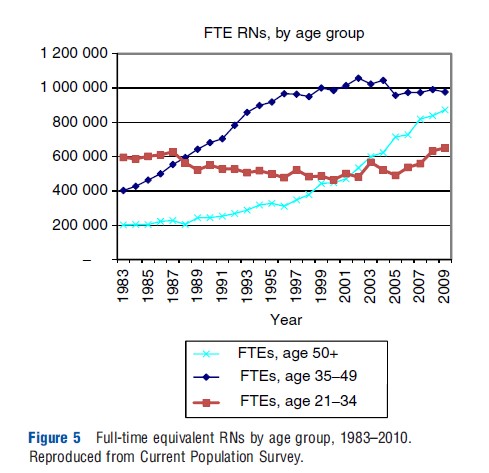
The average age of the RN workforce has been increasing rapidly over the past several decades (Figure 4), from 37.1 in 1983 to 43.2 in 2010. Figure 5 shows the number of RNs participating in the workforce broken into three age groups: under 35 years, between 35 and 49 years, and more than 50 years. Among these groups, the number more than 50 quadrupled from roughly 200 000 in 1983 to nearly 900 000 in 2010. The number of middle-aged RNs (35–49) more than doubled over the same period from 400 000 to nearly 1 000 000, whereas RNs under 35 grew very little and in the present day are just above 600 000. These trends reflect the very large baby boom cohorts who entered nursing in unprecedented numbers in the 1970s and 1980s. In the decades that followed, other professional opportunities opened up for career-oriented women and entry into nursing declined (the groups following the baby boom were also smaller in size due to declining birth rates). Thus, as baby boom RNs have moved through the workforce, the average age has increased. Rapid renewed entry into the nursing profession over the past decade has stabilized the average age and lessened expected future shortages. Nevertheless, as large numbers of RNs of more than 50 years of age retire over the next decade, shortages of RNs may again develop.
Education
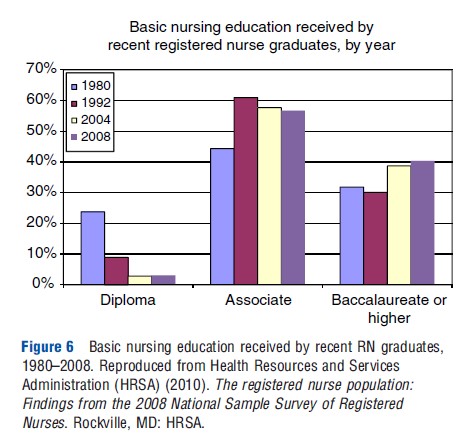
The educational preparation of RNs in the present day occurs in community colleges or in baccalaureate degree nursing education programs, whereas many of the large number of RNs born in the baby boom generation received their nursing education in hospital-based diploma programs. In 2008, according to the NSSRN, community colleges produced the majority of graduates in 2008 (Figure 6).
Overview Of Factors Affecting The Demand And Supply Of Registered Nurses
Like any labor market, the performance of the RN labor market as indicated by wages and output (number of RNs or hours worked) is determined largely by forces affecting the demand and supply of RNs. On the demand side of the market, forces arise from factors that determine society’s overall demand for healthcare and from a different set of factors that healthcare organizations consider when deciding on the quantity of RNs to employ. The authors will not focus on forces that affect society’s overall demand for healthcare, but rather, will focus on areas where that demand may particularly differ for RNs. With regard to the supply side of the market, which is more idiosyncractic to RNs, they distinguish between forces that determine the long-run supply of RNs (the number of individuals choosing to become an RN) and forces that influence the short-run supply of RNs (participation in the labor market and number of hours worked by existing RNs).
Societal Factors Affecting The Demand For Registered Nurses
Factors that determine society’s total demand for healthcare include changes in the health, size, age, and ethnic composition of the population; economic factors; and the organization of the healthcare system. As 60% of RNs work in hospitals, elements that particularly increase demand for hospital care would disproportionally increase the demand for RNs. Changes in the prevalence of diseases requiring hospital care such as congestive heart failure (or needs brought about by old age such as knee and hip replacement) could particularly result in increased need for RNs. The proportion of the US population that is more than 65 years of age will grow from 13% in 2010 to 16% in 2020 to 19% in 2030 – suggesting an increase in the demand for hospital care.
In the near future, the out-of-pocket price of healthcare services will decrease for many of the estimated 32 million Americans that will obtain health insurance in 2014 under the Patient Protection and Affordability Care Act, the health reform legislation passed in 2010, also potentially increasing the demand for healthcare. Although ambulatory care is generally more sensitive to out-of-pocket price than hospital care, it is possible that an increasing proportion of RNs will be employed in ambulatory care in the future if systems devote resources toward patient-centered medical homes and primary careintensive preventive services (Sochalski and Weinder, 2011).
Organizations’ Demand For Registered Nurses
Healthcare delivery organizations are in the business of producing goods and services to satisfy society’s demand for healthcare. Because producing many of the goods and services requires RNs (other nursing personnel, other labor, and capital), the number and type of nursing personnel employed at any given time is a function of organizations’ demand for nursing services. With respect to RNs, demand is determined by the productivity of RNs relative to nonprofessional nurses, assistive personnel, and capital, the wages and input prices of these other productive factors, and the ability to substitute one type of input for another in the heath production function.
Briefly, the higher (lower) the wages and fringe benefits, it must pay to hire RNs, organizations demand fewer (more) RNs, holding all else constant. The supply of RNs available at the time employers are seeking to hire additional RNs and the quantity of RNs demanded determine the wage RNs can command in the market, and hence the quantity of nurses that employers’ can afford to employ. Although RNs command a higher wage than Licensed Practical Nurses, their productivity relative to their wage (marginal product) is greater because they can legally provide a greater number of nursing services. Thus, organizations’ demand for RNs is influenced by whether the output organizations are producing requires nursing services that can only be provided by RNs or can be produced by using LPNs or others. For example, long-term care organizations typically provide patient care services that can be provided at less cost by LPNs, whereas the nursing services needed in most acute care hospitals require far more RNs relative to LPNs or nonlicensed personnel.
As the healthcare system has become increasingly focused on improving the quality and safety of care, hospitals have begun to pay more attention to the additional quality and safety that can be obtained by hiring RNs relative to other nursing personnel. Over the past few years, both public and private payers have begun to link hospital payment to patient outcomes that are sensitive to the care provided by RNs; should such incentives be expanded to outpatient and nonhospital settings, then demand for RNs could increase in these settings as well.
Organizations also consider the changing relationship between capital and labor when they determine their overall demand for RNs. Clearly, the combination of resources used to produce healthcare in a hospital a decade ago is not the same as those used to produce health services in the present day. With respect to nursing personnel, the roles and productivity of one type of nurse relative to another (e.g., an LPN versus APRN) have changed markedly over the years due to modifications in state practice acts, innovations in nursing education, changes in institutional policies, emergence of evidence-based practice, collective bargaining agreements that have expanded or restricted the performance of tasks by different types of personnel, and by efforts to mandate patient-to-nurse staffing ratios.
In sum, given the forces affecting society’s demand for healthcare and assuming that enough RNs are available and willing to work at the wages and working conditions offered by employers, most healthcare organizations seek to employ the number and mix of RNs and other nursing personnel that can most efficiently produce the treatments and services consistent with the organization’s objectives, budget, quality standards, and the ways that other healthcare personnel, capital, and technology can be productively combined.
Forecasts Of Registered Nurse Demand
The Bureau of Labor Statistics (BLS) and HRSA have estimated the societal and organizational factors affecting the demand for RNs and both indicate increasing demand for RNs over the near-term future. Based on industry surveys, the BLS estimates overall job opportunities for RNs will increase by 22% from 2008 to 2018, a rate of growth that is much faster than the average of all occupations (averaging between 7% and 13% over the same time period). According to the BLS, growth will be driven by technological advances in patient care, an increase in preventative care and growth in the population of older citizens. Further, the BLS expects that employment growth in hospitals will be slower (17%) than in nursing care facilities (25%), home healthcare services (33%), and offices of physicians (48%).
In 2004, HRSA projected that the future requirement of RNs through 2020 would increase by more than 800 000 FTE RNs more than 2000 levels. These projections, however, were made before the passage of health reform legislation in 2010, and thus demand is likely to exceed these projections as an estimated 32 million Americans gain greater access to health insurance coverage during the decade.
Factors Affecting The Supply Of Registered Nurses
When thinking about the supply of RNs, it is useful to differentiate between the short- and long-run supply of RNs. The short-run supply of RNs refers to the decisions of existing RNs to participate in the labor market and number of hours to spend working. If, for example, we are interested in increasing the supply of RNs to help resolve a nursing shortage, then any increase in RN supply will come initially from stimulating the number of currently available RNs to participate in the workforce or, if they are already working, to increase the number of hours they are willing to work (or both).
Changing the short-run supply of RNs can be accomplished by manipulating factors that existing RNs consider when deciding whether to participate in the nurse labor market and the number of hours they are willing to work. In contrast, because it takes between 2 and 4 years for an individual to complete a basic nursing education program, the long-run supply of RNs refers to the number of RNs that will be available at some point in time in the future. Thus, an expansion in the long-run supply of RNs will not address a shortage of RNs that is being experienced in the present day but may help resolve a future shortage.
Short-Run Supply
RNs’ participation and hours decisions are determined by economic and noneconomic factors. Economic factors include the RN’s wage (and fringe benefits) and nonwage income (primarily the income of the RN’s spouse). In economics, when wages change, both substitution and income effects are elicited. However, because the substitution and income effects exert opposite effects on labor supply decisions, whichever effect dominates will determine RNs employment decisions, holding the effects of other economic and noneconomic factors constant. Many studies of RNs’ short-run labor supply show that, on average, increases in wages tend to exert a positive but relatively small impact on the number of hours worked by RNs and a greater impact on the decision of nonparticipants to rejoin the workforce (Sheilds, 2004). With regard to the impact of nonwage income on RNs’ labor supply decisions, evidence from labor supply studies indicates that increases in nonwage income exert a negative and substantial impact on participation and hours worked, holding all else constant. Because a majority of RNs are married women, a spouse’s income is a significant source of income for many RN households. The effect of spouse income is related to the observed counter-cyclical effect of RN labor supply and the economy as a whole. For example, Buerhaus et al. (2009) showed that RN employment tends to grow much faster during and immediately after recessions, with much of employment growth linked to older RNs rejoining the workforce or working more hours. Quantitatively, the authors calculate that a percentage point increase in the unemployment rate is associated with a 1% increase in RN labor supply.
Noneconomic factors also influence RNs’ labor market decisions. These factors include: the presence of children (approximately 70% of RNs are married, and studies show that young children at home exert a substantial demand on the RN’s time and hence a negative effect on RN participation and hours worked); older adults living in the RNs’ household (few studies have examined the impact on the RNs’ labor supply decisions, although studies of women in the overall workforce indicate that caring for older adults decreases participation and hours worked substantially); enrollment in education programs (many RNs are obtaining their bachelor’s or master’s degree and thus have less time available to work in the labor market), demographic characteristics such as age (older RNs work more hours), race (nonwhite RNs have higher participation rates and work more hours) and gender (most studies show that men have higher participation rates and work more hours than women). However, because it is difficult to change the noneconomic factors that affect RNs’ decision to work, employers rely on changing wages and fringe benefits to influence the short-run labor supply decisions of existing RNs.
Long-Run Supply Of Registered Nurses
In contrast to the short-run supply of RNs that involves the labor market decisions of existing RNs, the long-run supply of RNs concerns the total number of RNs, who will be available in the future. A key factor affecting the long-run supply of RNs is the number of women in the US population between the ages of 20 and 40 years that make up the largest pool of individuals from which nursing education programs draw applicants. As large numbers of women born during the baby boom generation (1946–64) entered their twenties, the size of the pool of women increased in the late 1960s and continued expanding for the next 20 years. Consequently, these pools ‘produced’ large numbers of RNs. Since 1985, however, the size of the population pool 20–40 has remained relatively stagnant and is projected to change very little over the next 10–15 years.
RN nursing students are drawn into nursing for a variety of personal interests and motivations. However, the growth in new career options for women in the 1980s and 1990s led to a declining propensity of women choosing a nursing career (at the same time that the size of applicant pools were no longer increasing). More recently, enrollments have expanded, suggesting that interest in becoming an RN has increased. Internationally educated RNs, who join the US nursing workforce, have also helped expand the long-run supply of RNs; since the mid-1990s, IENs have been increasing both in number and as a proportion of the nursing workforce in the US.
Economic factors such as tuition, time costs, and prospective earnings also influence the long-run supply of RNs. For some people, the tuition charged by nursing education programs relative to the tuition required by other careers the individual is considering is an important factor in making the decision to become an RN. The less time it takes for an individual to recoup their investment in a nursing education, given his or her particular skills, the more likely they will become an RN. For individuals who are on the brink of deciding to choose nursing or a different career, RN wages in the nurse labor market can influence their decision, especially if wages are increasing and the individual is aware of the improving economic prospects in nursing.
The capacity of the nursing education system should respond to demand for RNs and interest in becoming an RN in the population – however, that response may be uneven due to institutional or other constraints. Shortages of faculty have been reported since the early 2000s – an oft-cited reason for ts being turned away from nursing education programs each year since 2002. That constraint seems to have eased recently, as the past few years have seen strong growth in nursing programs, new graduates and RNs entering the workforce.
Projections Of The Long-Run Supply Of Registered Nurses
Projections made by the authors in 2000 and HRSA in 2004 suggested that the number of RNs would grow slowly through the current decade, level off for several years, and then decline by 2020 as RNs retire from the workforce. Subsequent projections (Auerbach et al., 2007; Buerhaus et al., 2009) revealed that the future supply of RNs was beginning to grow in response to national initiatives to attract people into nursing. These initiatives appear to have had their desired effect on increasing enrollment into nursing education programs by both young people graduating from high school and by those in their 30s deciding to leave their nonnursing occupation and become an RN.
Registered Nurse Shortages
Perhaps no other topic related to the nursing workforce has dominated the attention of federal and state legislators, workforce planners, nursing organizations, and the media more than hospital shortages of nurses. Shortages have occurred frequently in the US and affect hospitals’ (and other care delivery organizations) ability to operate safely and provide access to healthcare. From an economic perspective, a shortage of hospital RNs reflects market disequilibrium in which hospitals’ demand for RNs exceeds the existing supply of RNs at the prevailing wage (including nonwage benefits). Thus, a shortage is a market disequilibrium in which labor demanded by hospitals exceeds labor supplied by RNs because the wage lies below the equilibrium wage – the wage level in which demand and supply are in balance. The shortage will not begin to disappear until wages increase to a level that brings about an increase in RNs’ short-run labor supply (an increase in participation or hours worked, or both) that satisfies a hospital’s demand. If, however, the hospital’s demand for nurses continues to expand at the same time that wages are rising, the shortage of RNs will persist.
Figure 7 shows the supply and demand for hospital RNs, with the labor supply curve upward sloping, whereas the labor demand curve is downward sloping. At the point where demand and supply intersect, the wage level (W1) is such that the supply of RN labor is exactly equal to the demand for RN labor at employment level E1. At any higher wage level, such as W2, there will be a surplus of RNs seeking jobs because the higher wage increases supply while at the same time reduces hospitals’ demand for RNs. In Figure 7, the surplus is reflected in the horizontal distance between the supply and demand curves at wage level W2. Competition among the surplus RNs to obtain the limited number of hospital jobs will eventually place downward pressure on wages, decreasing wages toward W1 until the supply and demand intersect W1, the equilibrium wage.
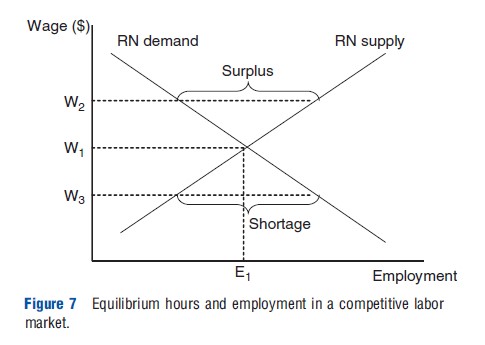
Similarly, at any wage level below W1, such as W3, there will be a shortage of RNs as the lower wage decreases the supply of RNs and increases employers’ demand for RNs. The shortage is shown in Figure 7 as the horizontal distance between the demand and supply curves at wage level W3. Competition among employers to obtain the limited number of RNs will exert upward pressure on wages, pushing wages again back toward W1. Thus, the point at which labor supply and demand intersect determines the unique equilibrium combination of wage and employment levels (W1 and E1) that will result in an equilibrium market. During a shortage, competition among employers to obtain the limited number of RNs will put upward pressure on wages, pushing wages back to their equilibrium level. Thus, shortages should not exist for extended periods, at least in a competitive labor market or in the absence of restrictions that prevent wages from increasing.
If hospitals’ demand for RNs increases, the hospitals may find that there are not enough RNs willing to supply their services at the wages they are offering and a new shortage will develop. The development of the shortage is shown in Figure 8 and focuses initially on the long-run equilibrium wage, W1, at which the short- and long-run supply of RNs are equal to the demand for RNs. In the short run, the outward shift in RN demand from D1 to D2 results in a shortage of RNs. The shortage develops because not enough RNs are willing to supply their time to hospitals at this prevailing wage rate, W1. However, as soon as RN wages increase and reach a new equilibrium at the point where the new labor demand curve (D2) crosses the short-run labor supply curve, the shortage will disappear. This movement along the short-run labor supply curve results in much higher wages and somewhat higher employment in the short run (increased participation and hours worked by existing RNs) from E1 to E2,SR. In other words, the increase in RN wages will first stimulate some existing RNs to respond in the short run by rejoining the workforce, moving from nonhospital settings into hospitals or by working additional hours (switching from a part-to full-time basis, working overtime or even working a second job). Eventually, in the long run new individuals will choose to become RNs drawn to nursing by the wage increase, thus multiplying the effect of the initial short-run response to the wage increase. Thus, over time, the new equilibrium will move to the point where the new labor demand curve (D2) crosses the long-run labor supply curve at W2,LR, in Figure 8. Thus, outward shifts in the labor demand curve tend to primarily increase wages in the short run, whereas having more of an impact on employment (and less on wages) in the longer run.
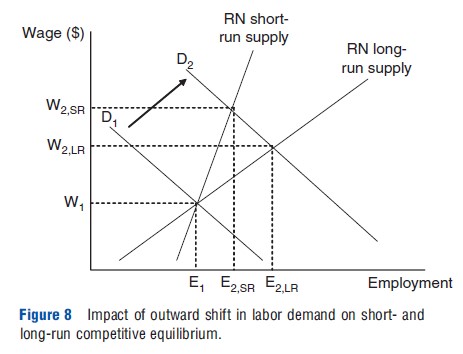
As noted above, shortages of RNs tend to be transitory and corrected by increases in the wage rate unless hospitals do not increase RN wages or for some reason are blocked from raising them. Unless demand is continuing to expand at the same time, the increased long-run supply of RNs will, in turn, exert downward pressure on wages. As the wage rate decreases, employers will be willing to hire additional RNs until they reach the point depicted by E2,LR and the labor market for RNs will once again adjust to a new long-run equilibrium wage and employment level of RNs.
If a hospital’s demand for RNs should increase again, the hospital may find that there are not enough RNs willing to supply their services at the prevailing wage it is offering and consequently a new shortage will develop. The series of short- and long-run adjustments will begin a new, and eventually a new market wage will be reached where the long-run demand and supply of RNs are in balance and employment levels are higher. The repetition of this cycle of demand, supply, and wage adjustments is often referred to as the ‘cyclical’ shortage of nurses.
The speed with which shortages are resolved depends on several factors including: how high and quickly a hospital increases RN wages; how sensitive RNs are to the wage increase (the RN wage elasticity of supply); and how sensitive is hospitals’ demand for RNs over the range of wage increases they are considering offering RNs (the employers’ wage elasticity of demand for RNs).
History Of Hospital Registered Nurse Shortages
Surprisingly, although hospitals have reported shortages of RNs in every decade since the 1960s, there is no agreement about how to define and measure shortages. One common indicator of shortages is the job vacancy rates reported by hospitals (the percentage of vacant FTE RN positions that hospitals are actively trying to fill). In general, reports of hospital shortages typically occur when FTE RN vacancy rates exceed 4%. Most, but not all, reported hospital RN shortages since the mid-1960s were driven by increases in the demand for RNs and were resolved after hospitals’ increased real wages.
For several years before the creation of the Medicare and Medicaid programs in 1965, hospital RN vacancy rates were very high, exceeding 15%. The new financial resources provided by the Medicare program enabled hospitals to increase RN wages, which subsequently brought about an end to the shortage by the end of the decade. During the 1970s, demand for RNs continued to grow, but wage controls imposed by the federal government via the Nixon administration’s Economic Stabilization Program combined with high inflation rates restricted the increase in RN wages from rising fast enough to bring hospitals’ demand and supply of RNs into equilibrium. Consequently, hospitals reported double-digit RN vacancy rates and shortages of RNs during most of the 1970s.
Following large increases in real wages in the early 1980s, hospital RN vacancy rates began decreasing and the shortage ended quickly. However, with the beginning of the Medicare prospective payment system in 1983, hospitals faced new incentives to become more efficient and, among other adjustments, shifted less acutely ill patients to lower cost outpatient departments. Because RNs are more productive than LPNs at the prevailing wages, hospitals’ demand for RNs increased. Throughout the decade, hospitals’ demand for RNs increased approximately 3% annually and despite increases in real wages, the supply of RNs was unable to catch up to the significant growth in demand, resulting in hospitals once again reporting RN shortages during much of the latter part of the 1980s.
During the 1990s, the growth in the hospitals’ demand for RNs slowed to approximately 2% per year as managed care developed rapidly. Both RN hospital vacancy rates and real wages soon decreased, bringing the shortage of RNs to an end. The increased number of RNs joining the RN workforce that were being supplied by nursing education programs resulted in an apparent surplus of RNs during the mid-1990s and real earnings and vacancy rates both decreased. However, by the end of the decade, yet another RN shortage was reported by hospitals but, in this case, the shortage was concentrated in intensive care units (ICUs) and operating rooms.
When data on RNs were analyzed by age categories, hospital unit, and educational background, it was discovered that the shortage broke out in these units because they were the first to experience the implications of underlying changes in the age and education composition of the RN workforce that resulted in a decrease supply of certain types of RNs. Shortages reported by ICUs and step-down units resulted from a decrease in the number of younger RNs entering the workforce who have a greater propensity than older RNs to work in critical care units. Shortages in operating rooms resulted from the decline in the number of older diploma-educated graduates who had a greater propensity to work in this setting, as they began to retire from the workforce. This analysis demonstrated that unlike the earlier shortages that were driven by increases in demand, the shortage that developed in 1998 was driven by supply-side factors reflected by the changing age composition of the RN workforce.
Impact Of Recent Recessions On Hospital Registered Nurse Shortages
By the early 2000s, the hospital RN shortage spread throughout other nursing units as demand for hospital care began to increase. In 2001, hospital FTE RN vacancy rates exceeded double-digit levels. However, during 2001 a recession developed, and though it lasted only 8 months, unemployment rates remained high over the next 2 years (Table 3). Because the majority of RNs are married, increases in overall unemployment meant that many RN spouses either lost their job or feared that they could be laid off. To ensure the economic welfare of their households, many RNs who were not working at the time, particularly married RNs, rejoined the nursing workforce. During 2002 and 2003, hospital RN employment increased dramatically, shooting up by an estimated 185 000 FTEs. This burst in RN employment decreased the impact of the nursing shortage and reduced vacancy rates to approximately 8% by the end of 2006. As the shortage continued into 2007, it became the longest lasting shortage of hospital RNs in the past 50 years.
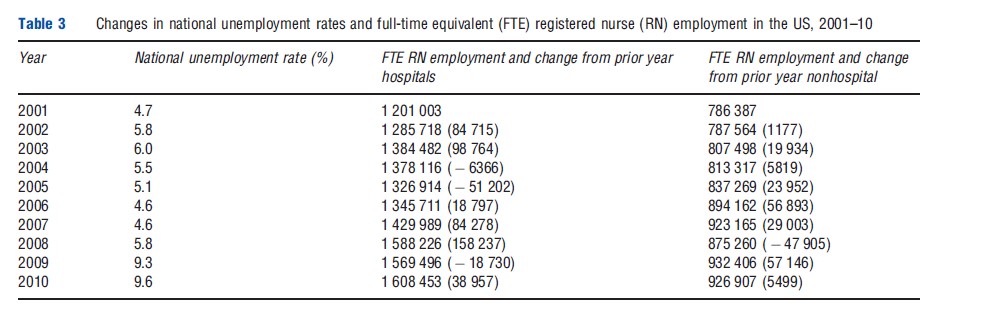
The second recession of the past decade began in December 2007 and lasted through June 2009, even though monthly unemployment rates continued to increase before peaking at 10.1% in October. Once again, hospital RN employment increased as nonparticipating RNs rejoined the hospital workforce and other RNs, who were already working increased their work hours. During 2007 and 2008, hospital RN employment surged, adding nearly one-quarter million FTE RNs. Moreover, more than 100 000 of this increased employment occurred among RNs older than 50 years of age, suggesting that some RNs who had retired rejoined the workforce. Another 50 000 RNs left their positions in nonhospital settings for higher paying hospital jobs, which also offered richer benefits (particularly health insurance coverage) and flexible work hours. Although national estimates of hospital RN vacancy rates are not available to assess the effect of this employment increase, anecdotal reports suggest that the national shortage of RNs that had begun a decade earlier in 1998 had finally come to an end for many hospitals (Auerbach et al., 2011).
The Future Of The Registered Nurse Workforce
Over the decade, the RN workforce will be dominated by older RNs in their 50s. Because the number of RNs in their 50s is so large (approximately 900 000), it will be very difficult to replace these RNs with new entrants, and thus new shortages are expected. These shortages could be larger than previous shortages of RNs experienced since the 1960s and could take an extended period of time for the labor market to adjust and establish a new equilibrium in which the shortage disappears.
Currently, the looming threat of large retirements from the workforce is masked by the lingering effects of the recent recession on the labor supply decisions of the current workforce. Average monthly unemployment rates remain above 8% and appear to be continuing to stimulate record high participation in the labor market by the existing stock of RNs. Reports of new graduates of nursing education programs having substantial difficulty finding jobs suggest that the hospital labor market may be in equilibrium. However, once the economy strengthens and there is a strong jobs recovery, many currently employed RNs, particularly older RNs, may retire from the workforce. If large numbers of RNs exit and if they withdraw from the workforce rapidly, then a new shortage is likely to develop. However, the stock of new graduates waiting for new jobs to develop may be large enough to enter the labor market and replace those exiting and thereby decrease the risk of new shortages developing.
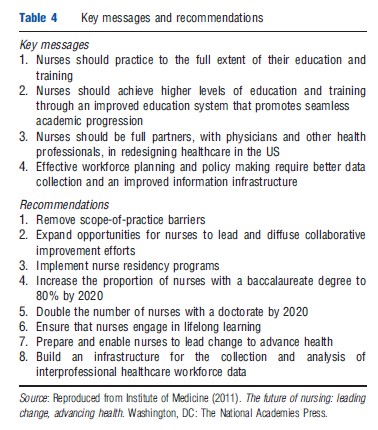
Beyond these uncertainties, the nursing profession faces other challenges, particularly in an era of health reform. Many of these challenges are described in a recent report by the Institute of Medicine (IOM), The Future of Nursing: Leading Change, Advancing Health. The IOM report offered four key messages and eight recommendations aimed at strengthening the nursing workforce (Table 4). Several of these were aimed at strengthening patient centered, high quality, coordinated, primary care that is expected to be in great demand as the number of the insured grow while physicians increasingly move toward specialization. Although it is beyond the scope of this article to discuss these messages and recommendations in detail, one recommendation calling for removing barriers restricting NPs’ scope of practice has received considerable attention from the media, health policy makers, and many in the medical profession. Therefore, the authors conclude the discussion of the professional nursing workforce by providing a brief overview of APRNs.
The Advanced Practice Nurse Workforce
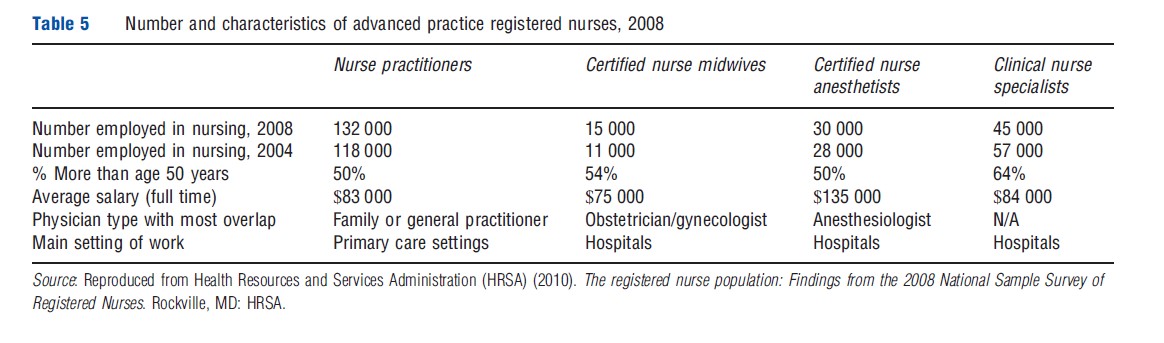
The term APRN refers to four types of nurses who have received advanced education and training beyond that required to become an RN and include NPs, certified RN anesthetists (CRNAs), CNS’s, and CRNMs. Most states require APRNs to complete a master’s degree in nursing, and the vast majority of state legislature have delegated to state boards of nursing the authority to establish requirements for certification examinations in each type of APRN and in the various advanced practice subspecialties. In a few cases, the state board of medicine holds this authority (Cuningham, 2010). Data from the NSSRN indicate that approximately 8% of RNs or 220 000 of 2.6 million RNs employed in nursing in 2008 were APRNs. Below, the authors briefly describe the roles and key characteristics of each type of APRN (see Table 5).
Nurse Practitioners
NPs are the largest and most rapidly growing APRN. According to the HRSA (2010), an estimated 130 000 NPs were working in nursing in 2008, double the number estimated a decade earlier. The role of NPs was established in the mid-1960s and focused on serving women and children in rural and underserved inner city areas where physicians were scarce. In the present day, NPs work across many populations and geographic regions and their focus have expanded to include family care, pediatrics, geriatrics, adult health, women’s health, psychiatry, neonatology, and acute hospital care of adults and children. Currently, 39% of NPs work in hospital settings, particularly in specialized inpatient care units and hospital-affiliated primary care clinics, approximately 36% provide primary care in traditional ambulatory care settings (including retail clinics), and 12% work in public and community healthcare agencies and in schools. In 2008, full-time NPs earned $83 000 on average in 2008, compared to $67 000 for all RNs HRSA (2010).
Clinical Nurse Specialists
Although the number of CNS’s has declined recently, CNS’s are the second-largest type of APRN and are estimated to number approximately 45 000 in 2008. The role of a CNS is to improve clinical care, primarily in hospitals and extended care facilities, by providing advanced clinical nursing expertise to help coordinate care for individuals, educate nursing personnel who provided direct care, and help identify and improve aspects of the health system organization that affect patients and nursing staff. CNS’s have expertise in one or more clinical areas such as oncology, pediatrics, geriatrics, psychiatric/ mental health, adult health, obstetrics, acute/critical care, and community health. Although about half of CNS’s are employed in hospital settings, often in administrative or supervisory roles, CNS’s also work in ambulatory care, public health, and academic settings. Nearly 64% are over the age of 50 years, making them the oldest group of APRNs. Average earnings for a full-time CNS were $86 000 in 2008.
Certified Registered Nurse Anesthetists
Nurses have been providing anesthesia since the Civil War and in the present day provide approximately 32 million anesthetics annually in the US and represent two-thirds of anesthetists in rural hospitals (American Association of Nurse Anesthetists, 2011). Most (82%) CRNAs not only work in a hospital operating room, but they also deliver anesthetics in birthing centers/obstetrics departments, dental offices, emergency rooms, plastic surgery centers, and outpatient surgery facilities. CRNAs play a particularly important role providing anesthesia in the military and the Veterans Administration and in hospitals located in rural areas. There were roughly 30 000 CRNAs working in 2008, a 16% increase from 2000. On average, CRNAs are younger and more likely to be male (more than 40%) than other APRNs. In 2008, CRNAs reported average earnings of $136 000, which is much higher than all other groups of RNs or other APRNs HRSA (2010). Unlike anesthesiologists, CRNAs are more likely to work in rural rather than urban areas.
Certified Nurse Midwives
CNMs care for women before, during, and after childbirth. Their role began in the nineteenth century to fill a particular need in impoverished urban and rural areas with limited access to physicians. Nurse midwifery arose both in New York City and Kentucky in the late nineteenth and early twentieth centuries. The earliest US nurse midwifery programs were designed to meet the needs of special populations in urban, rural, and impoverished populations with limited access to physicians HRSA (2010). Most CNMs work in hospitals, with 42% specializing in labor and delivery, 34% in obstetrics, and 14% in gynecology or women’s health. One-fourth worked in ambulatory care settings in 2008. There were approximately 15 000 CNMs employed in nursing in 2008, making them the smallest group of APRNs, although their numbers have grown since 2004. CNMs earned $75 000 on average in 2008, and 55% were more than age 50 years.
Overlap With Physicians
CNMs, CRNAs, and particularly NPs perform roles throughout the healthcare delivery system and provide many services that overlap considerably with those of physicians (respectively, obstetricians/gynecologists, anesthesiologists, and physicians proving primary care such as internists, pediatricians, and family practitioners). That overlap has several implications. First, areas of the country that have difficulty attracting physicians (particularly rural or inner city areas) have relied on APRNs to fill workforce gaps. Consequently, APRNs are more likely to work in rural and inner city areas and serve patients that are less likely to have private insurance. Second, the degree to which APRNs can substitute for physicians has resulted in a growing literature and policy debate about whether APRNs provide care of comparable quality to their physician counterparts. Most studies find that NPs can successfully handle up to 80% of primary care visits, and that the care received by patients seeing either an NP or a primary care physician is comparable in terms of quality or resource use (Newhouse et al., 2011). Some studies have employed randomized clinical trials, for example, assigning patients to either NPs or primary care physicians (Laurant et al., 2004). In light of projections of shortages of primary care physicians by 2020 (Association of American Medical Colleges, 2011) and because provisions in the Patient Protection and Affordable Care Act will expand the insured population and demand for primary care (Ku et al., 2011), the demand for NPs is likely to grow as will the controversy surrounding policies that call for expanding the NP workforce to make up the gap in primary care (Naylor and Kurtzman, 2010; Pohl et al., 2010). Similar debates over quality and practice restrictions also involve CRNAs (Dulisse and Cromwell, 2010).
All states regulate the boundaries of practice governing the services each type of APRN is permitted to perform. Particularly in the case of NPs, ‘scope of practice’ laws regulate aspects of practice such as the required level of physician supervision and collaboration and the ability to prescribe medications. Critics of these laws assert that they reduce access and increase the cost of care by forcing patients to seek care from physicians who typically charge higher prices than NPs. Defenders argue that they are necessary to protect patients from low-quality care and unsafe practice. Currently, such laws vary widely from state to state and this variation is viewed by some as hampering reimbursement by private insurers to NPs in certain states (Tine-Hanson-Turton et al., 2006).
An analysis of state scope of practice laws that governed NPs and CNMs from 1992 to 2000 suggested that the state laws were becoming less restrictive during this period (HRSA, 2000). Considerable variation and restrictions remain, however, as illustrated in Missouri where new patients who had an initial visit with an NP had to be seen by a physician within 2 weeks or in South Carolina that requires a supervising physician be available at all times for consultation. Some states only permit NPs to prescribe certain medications or to refer patients for laboratory tests on an approved list (Lugo et al., 2007; HRSA, 2000). As of 2010, 16 states allowed NPs to practice independently from a physician (Fairman et al., 2011).
Scope of practice issues for CNMs are similar to those of NPs, with states varying on the degree of prescriptive authority, supervision by physicians, and the extent to which CNMs can be reimbursed directly (HRSA, 2000). Yet, despite extensive state variation in scope of practice for NPs and CNMs, there is little research or evidence as to the effects of the laws on processes and outcomes of care.
Summary
Much of the production and distribution of personal healthcare services in the US depends on professional nurses, RNs and APRNs, who are employed in wide variety of clinical and nonclinical positions in countless organizations. Professional nurses deliver basic and advanced nursing care services, practice nursing independently, and function as both complements and substitutes to physicians. The RN workforce is dominated by the large and aging baby boom cohorts who are expected to retire in large numbers over the decade, threatening to create a new nurse shortage in hospitals and other settings, particularly as the demand for healthcare expands due to the implementation of health reform, the aging of the baby boom generation, and other factors. How long it will take for a new equilibrium to be reached in the nurse labor market will depend on how many RNs retire, whether there will be enough new RNs to replace them, how much demand grows, and how effectively organizations adjust to these changes. Increasing demand for healthcare also affects physicians, particularly primary care physicians whose supply is projected to fall below the estimated demand by the end of the decade. Because NPs are viewed as being good substitutes for the majority of primary care services provided by physicians, healthcare policy makers are focusing on efforts to allow NPs and other APRNs to practice to the full extent of their education and training by reforming restrictive state laws and nurse practice acts.
References:
- American Association of Nurse Anesthetists (2011). About AANA http://www.aana.com/aboutaana.aspxid=46 (accessed 09.05.11).
- Association of American Medical Colleges (2011). Physician shortages to worsen without increases in residency training. Available at: https://www.aamc.org/ download/150584/data/physician_shortages_factsheet.pdf (accessed 08.05.11).
- Auerbach, D., Buerhaus, P. and Staiger, D. (2007). Better late than never: Workforce supply implication of later entry into nursing. Health Affairs 26(1), 178–185.
- Auerbach, D., Buerhaus, P. I. and Staiger, D. O. (2011). Registered nurse supply grows faster than projected amid surge in new entrants ages 23–26. Health Affairs 30(12).
- Auerbach, D., Buerhaus, P. I. and Staiger, D. O. (2011). Registered nurse supply grows faster than projected amid surge in new entrants ages 23–26. Health Affairs 30(12), doi: 10.1377/hlthaff.2011.0588.
- Buerhaus, P., Auerbach, D. and Staiger, D. (2009). The recent surge in nurse employment: Causes and implications. Health Affairs 28(4), w657–w668, Web Exclusive, June 12.
- Cuningham, R. (2010). Tapping the potential of the health care workforce: Scope-of-practice and payment policies for advanced practice nurses and physician assistants. National Health Policy Forum, background paper no. 76, The George Washington University, Washington, DC.
- Dulisse, B. and Cromwell, J. (2010). No harm found when nurse anesthetists work without supervision by physicians. Health Affairs 29, 1469–1475.
- Fairman, J., Rowe, J., Hassmiller, S. and Shalala, D. (2011). Broadening the scope of nursing practice. New England Journal of Medicine 364(3), 193–196.
- Health Resources and Services Administration (HRSA) (2010). The registered nurse population: Findings from the 2008 National Sample Survey of Registered Nurses. Rockville, MD: HRSA.
- Ku, L., Jones, K., Shin, P., Bruen, B. and Hayes, K. (2011). The states next challenge – Securing primary care for expanded Medicaid populations. New England Journal of Medicine 364(6), 493–495.
- Laurant, M., Reeves, D., Hermens, R., et al. (2004). Substitution of doctors by nurses in primary care. Cochrane Database of Systematic Reviews, Issue 4 Art. No.: CD001271. DOI: 10.1002/14651858.CD001271.pub2.
- Lugo, N., O’Grady, I., Hodnicki, D. and Hanson, C. (2007). Ranking state NP regulation: Practice environment and consumer health care choice. American Journal for Nurse Practitioners 11(4), 8–24.
- Naylor, M. and Kurtzman, E. (2010). The role of nurse practitioners in reinventing primary care. Health Affair 29(5), 893–899.
- Newhouse, R. P., Stanik-Hutt, J., White, K. M., et al. (2011). Advanced practice nurse outcomes 1990–2008: A systematic review. Nursing Economic$ 29(5), 1.
- Pohl, J., Hanson, C., Newland, J. and Cronenwitt, L. (2010). Unleashing nurse practitioners’ potential to deliver primary care and lead teams. Health Affairs 29(5), 900–905.
- Sheilds, M. (2004). Addressing nurse shortages: What can policy makers learn from the econometric evidence on nurse labour supply? Economic Journal 114, F464–F498.
- Sochalski, J. and Weinder J. (2011). Health care system reform and the nursing workforce: Matching nursing practice and skills to future needs, not past demands. Appendix F: The Future of Nursing: Leading Change, Advancing Health. Washington, DC: The Institute of Medicine.
- Staiger, D., Auerbach, D. and Buerhaus, P. (2009). Comparison of physician workforce estimates and supply projections. Journal of the American Medical Association 302(15), 1674–1680.
- Tine-Hanson-Turton, T., Ritter, A., Rothman, N. and Valdez, B. (2006). Insurance barriers create barriers to health care access and consumer choice. Nursing Economic$ 24(4), 204–211.
- US Department of Health and Human Services, Health Resources and Services Administration (2000). A comparison of changes in the professional practice of nurse practitioners, physician assistants, and certified nurse midwives: 1992 and 2000. This study was funded by the National Center for Health Workforce Analysis Bureau of Health Professions Health Resources and Services Administration under Contract No. HRSA 230-00-0099.
- Buerhaus, P., Staiger, D. and Auerbach, D. (2008). The Nursing Workforce in the United States: Data, Trends, & Implications. Boston, MA: Jones-Bartlett, Inc.
- United States Department of Labor, Bureau of Labor Statistics (2011). Registered nurses. Occupational Outlook Handbook. 2010–11 ed. Available at: http://www.bls.gov/oco/ocos083.htm (accessed 06.05).
- US Department of Health and Human Services, Health Resources and Services Administration (2004). What is behind HRSA’s supply, demand and projected shortage of registered nurses?
- US Department of Labor (2011). Labor force statistics from the Current Population Survey. Available at: http://www.bls.gov/cps/home.htm (accessed 06.05.11).