In many countries, residents choose a health plan or sickness fund through which to receive health insurance benefits. These choices are regulated and at least partially paid for by governments and employers. Collective financing of health care redistributes the burden of cost from the sick to the healthy and from the poor to the rich. At the same time, societies seek the virtues of markets: choice, innovation, and price and quality competition from their health insurance plans. Melding the desires for both a fair yet controlled and efficient yet innovative health insurance sector is a central problem facing all developed nations. A common approach to this problem consists of national governments collecting the funds to pay for health care, but then passing responsibility for the purchasing of health care to a local organization, a private insurance plan as in the federal Medicare program in the US, a local government in the UK, Canada and Australia, or sickness funds as in Germany, Israel, the Netherlands and Belgium. Governmental involvement aims at a fair distribution of the cost burden, and competition among the decentralized participants is intended to promote efficiency. A critical element of the policy is paying more for the sick and less for the healthy as they join plans – the job of risk adjustment.
Defining Risk Adjustment
In this article ‘risk adjustment’ is referred to as a formula relating payment to a provider or a health plan to observable characteristics of a person (such as age, previous diagnoses). In the Medicare program in the US, Germany, Netherlands, Israel, and other countries, risk adjusted payments flow from governments to health plans when individuals enroll in private plans. Large provider groups are increasingly asked to bear risk, (this is the primary direction of US health policy) and risk adjusted payments come into play there as well. As provider payment and risk bearing become more central in health policies, the statistics and economics of risk adjustment take on increasing importance.
The evolution of health policy has put new demands on risk adjustment. This article reviews the two basic methods for deriving a risk adjustment, one primarily statistical, and a second introducing an economic objective into the statistical analysis. In the second method, finding the right risk adjustment is a problem in mechanism design. The authors begin with the basic model of adverse selection and derive the implications for risk adjustment. They then consider two applications with a close connection to the empirical methods that can be used to estimate risk adjustment weights.
The most common approach to risk adjustment is statistical. Conventional risk adjustment sees the goal of risk adjustment as matching payments to expected cost as closely as possible. If an older enrollee is expected to be twice as expensive as a younger enrollee, conventional risk adjustment would pay twice as much for the older enrollee. Many factors other than age matter for expected costs. Research on conventional risk adjustment is statistical and data oriented. Researchers seek to find the right combination of variables (referred to as risk adjustors) to include in regression models so that the explained variation in health care costs is high, without relying on risk adjustors that are difficult to collect in practice or can be manipulated by providers seeking to increase revenue. There is also discussion of whether certain variables should be recognized as part of risk adjustment, for example, if an individual chooses to smoke, whether he or she should be ‘rewarded’ by a higher risk adjusted payment. The premise behind this research – sometimes regarded to be so obvious as to not require justification or analysis – is that the healthcare market in question will function better, the better the job the regression model can do in predicting healthcare costs of enrollees.
By contrast, optimal risk adjustment views risk adjustment as a set of incentives to address an economic problem. Calculating the optimal risk adjustment begins with an explicit conception of how the relevant market functions, which relates the risk-adjusted price (e.g., the payment for young and old) to the behavior of payment recipients. The economic objective (usually efficiency) is also stated explicitly. Then, using mechanism design, the optimal risk adjustment is derived as the prices for young and old which maximize the efficiency of the health care market. Optimal risk adjustment does not refer to particular weights, but rather to a methodology by which the optimal weights are obtained. Optimal risk adjustment also relies on data, however, the optimal weights are not, in general, regression coefficients but a solution to a problem of economic maximization.
The Basic Adverse Selection Problem And The Role Of Risk Adjustment
A health plan can underprovide some services and overprovide others, attracting the low risks and deterring the high risks. The basic idea draws on the early analysis of insurance by Rothschild and Stiglitz. Demand for treatment of chronic conditions, for example, may be much better anticipated, and more unevenly distributed in a population, than demand for acute care. In such a case, the health plan has a financial incentive to distort the mix of its care away from chronic care and toward acute illness, in order to deter/attract the high/low risks. Nearly all writers on the efficiency of health insurance markets with managed care, acknowledge this effect, though they vary in the emphasis they put on it. When a plan can set premia as well as quality, a version of this strategy is to provide low quality overall, and set a low price, to attract the low-risks.
This quality distortion problem has received a good deal of attention in health economics literature. The basic adverse selection model is presented here. Suppose that there are two types of individuals, L and H, who can contract two illnesses, a and c. Illness a we call an acute illness and both types of people have the same probability of contracting this illness, pa>0. The two types are distinguished in their probability of contracting the chronic illness c. Let pi, iϵ{H,L} denote the probability that a person of type i contracts illness c. Then, pH>pL>0. The proportion of H types in the population is λ, 0<λ<1. Let pc≡λpH+(1-λ)pL denote the (expected) probability that a person randomly drawn contracts the chronic illness. Throughout the analysis it is assumed that each individual knows their type. It is also assumed that each individual must choose one plan.
If a person (of either type) has illness j, jϵ{a,c}, their utility from treatment will be increased by Vj(qj), where qj>0 denotes the ‘quality’ of the services devoted to treat illness j, with V`j>0 and V“j>0. If a person has both illnesses, their utility, if treated, will simply be increased by Va(qa)+Vc(qc). Treatment services are provided by health plans. A health plan is characterized by a quality pair (qa,qc). Thus, if a person of type i, iϵ{H,L} joins a plan with a quality pair (qa ,qc), their expected utility will increase by:
![]()
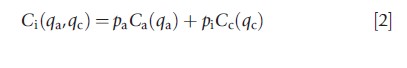
Throughout the analysis it is assumed that each plan gets to choose its quality pair and a plan can offer only one quality pair. All plans have the same cost function. A plan’s cost of treating a person with illness j, jϵ{a,c} at a quality level qj is Cj (qj), where C`j>0, C“j>0. Thus, if a person of type i, iϵ{H,L} joins a plan that offers a quality pair (qa, qc), the plan’s costs are expected to increase by:
The ‘socially efficient’ quality pair (q*a, q*c) equalizes marginal benefit of treatment to marginal cost, thus solving the following pair of equations:
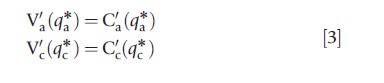
High and low risk types have different probabilities of becoming ill, but once ill, receive the same utility from treatment. Thus, the efficient level of quality is independent on the probability of becoming ill and is the same for both types.
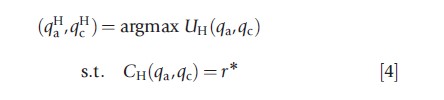
It is assumed that the Regulator can enforce an open enrollment policy. The order of moves in our model is as follows: First the Regulator/payer announces r *, the premium (paid by the Regulator/payer) a plan will receive per enrollee. Next, plans (simultaneously) choose their quality pair (qa,qc), then individuals choose plans and plans collect a revenue of r per enrollee, finally each individual’s health state (whether she has illness a and/or c) is realized and plans pay the costs of treatment. A ‘competitive equilibrium’ in this market is a set of quality pairs such that, when individuals choose plan to maximize expected utility, (1) no quality pair in the equilibrium set makes negative expected profit, and (2) there is no quality pair outside the equilibrium set that, if offered, will make a positive profit.
Following Rothschild and Stiglitz it is known that if the proportion of the H types in the population is sufficiently large, then a competitive equilibrium exists and is characterized by two quality pairs. H types choose the plan(s) that offer the quality pair:
and L types choose the plan(s) that offer the quality pair:

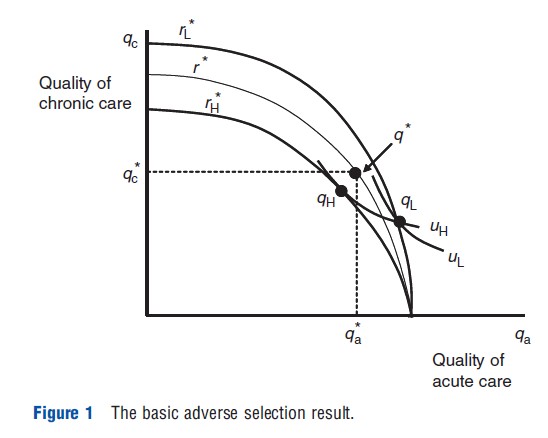
The equilibrium is described in Figure 1. The curves ri*, i=H, L represent all plans, i.e., pairs of (qa,qc), that break even if the plan attracts only individuals of type i, when the premium is r*. The points denoted by qi, i=H or L, depict the plan chosen by type i in equilibrium, i.e., qi = (qai,qci). Curves ui, i=H, L, represent type i’s indifference curves that goes through the point qi. The curve r* represents all plans that break even if the plan attracts a random sample of the population, and the point q* depicts the socially efficient levels of quality. It can, therefore, be seen that plans will not offer the socially efficient quality profile in equilibrium.
When the Regulator/payer is using risk adjustment, the premium paid to the plan (often referred to as ‘capitation’) is conditioned on observable characteristics of the enrollee. The capitation payment might be based, for example, on the enrollee’s age, with older enrollees having higher payments associated with them because they are expected to cost more.
It can be illustrated how conventional and optimal risk adjustments are calculated using this model. Assume that the Regulator gets a signal s about each consumer’s type. The signal could be, for example, the consumer’s age. Suppose that s can take a value of 0 or 1 (‘young’ or ‘old’). The signal contains information in the sense that type H person is more likely than type L person to get the signal 1. Let yi, i =H or L, be the probability that consumer of type i gets the signal 1. It is assumed that yH>yL≥0. (Note that if yH=1 and yL=0, the signal is perfect i.e., the Regulator knows the individual’s type.)
Let λs be the posterior probability the consumer is of type H given the signal s. Because the signal is informative, using Bayes’ rule one can show that 1≥λ1≥λ0≥0. Thus, if a person got the signal 1, that person is more likely to be of type H than a person who got the signal 0. Let,
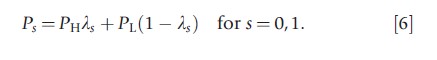
and
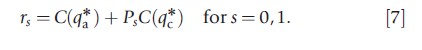
Ps is the probability that a person with signal s will contract illness c and rs is the expected health care costs of such a person at the efficient level of quality of care. Clearly P1>P0 and r1>r0. One can readily confirm that if plans are paid rs for each person who got the signal s, and consumers are randomly distributed across plans, plans break even providing the efficient level of care.
The capitation payment rs is what the authors mean by ‘conventional’ risk adjustment. It can be shown, however, that conventional risk adjustment does not implement the socially desired outcome, i.e., at the competitive equilibrium, plans do not provide the socially efficient quality. The same forces that break the efficient pooling equilibrium when premiums are not risk adjusted will also break the efficient pooling equilibrium when premiums are conventionally risk adjusted. Market equilibrium under conventional risk adjustment will still be a separating one where the H types and the L types choose different plans with a different quality profile. This separating equilibrium is more efficient (i.e., it induces a higher expected utility) than the one without risk adjustment, but it is not the best the Regulator can do. As demonstrated below, an optimal risk adjustment can be constructed to implement precisely the socially desired quality.
Let
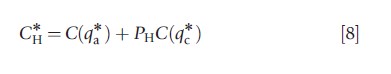
and
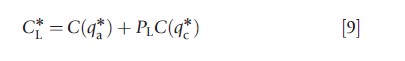
C*i is the expected costs of an individual of type i at the efficient quality profile.
The authors are now ready to discuss the conditions under which risk adjustors implement the socially desired contract:
Proposition: Let rs*, s = 0,1 be solution to the following system of equations:
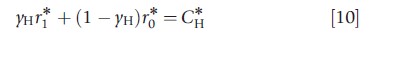
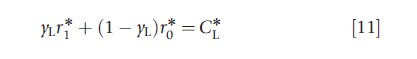
then if plans are paid a premium rs *, s = 0,1 for each individual who got the signal s, all plans will offer the socially desired quality in equilibrium.
The left hand side of eqn [10] is the expected premium a plan receives for each enrollee of type H, under the risk adjustment scheme rs*. The right hand side of eqn [10] is the plan’s expected cost of an enrollee of type H, under the socially desired quality bundle. Equation [10] states the condition for the expected premium for a type H individual to be equal to the individual’s expected cost. Equation [11] does the same thing for a type L individual.
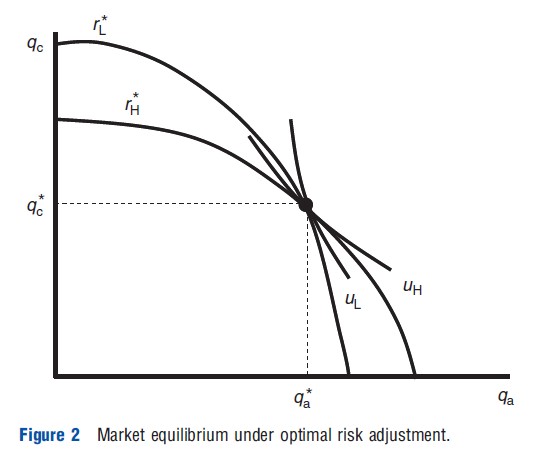
It can be easily verified that, if yH<1 and yL>0 then r1*>r1 and r0*>r0. Conventional risk adjustment redistributes some, but not enough, resources from the low-cost to the high-cost types. In Figure 1 this redistribution would appear as a shift in the zero-profit curves relative to the curves in the no risk adjustment case. As the proposition above shows, the Regulator may shift the zero-profit curves even further than is implied by conventional risk adjustment, by ‘overpaying’ for a consumer who got the signal 1, compensated by ‘underpaying’ for consumers who got the signal 0, and by so doing, bring the market closer to the socially desired outcomes. ‘Overpaying’ and ‘underpaying’ are in comparison to the conventional risk adjustment premiums. Figure 2 illustrates the equilibrium under optimal risk adjustment.
Intuitively, this result can be understood as follows: If the signal is not very precise, the difference in premium conventional risk adjustment pays, for a consumer who got the signal 1 and a consumer who got the signal 0, will be small. Furthermore, the proportion of consumers who got the signal 0 among the L-types is not much larger than the proportion of consumers who got this signal in the entire population. Thus, by offering a quality profile that attracts only the L-type consumers, a plan can reduce its cost by a significant amount relative to the reduction in the premium it is expected to receive. If, however, the premium for an individual who got the signal 0 is significantly lower than the premium for an individual with the signal 1, the plan is severely punished for attracting only individuals of type L.
Multiple Services And Maximizing Fit
The analysis just laid out can be made operational in a more realistic setting in which a plan is providing multiple services (not just two) and in which the Regulator’s objective in conventional risk adjustment of ‘best fit’ is also recognized.
When a plan decreases the stringency of rationing on a service, i.e., increases the level of spending on a service, costs are affected because spending goes up for existing enrollees and spending is incurred on enrollees newly attracted by the spending increase. The idea of optimal risk adjustment is to make sure that for all services a plan is making a decision about, from those used mostly by the healthy and cheap to those used mostly by the sick and costly, these cost increases are balanced against revenue gains to the same degree. This is done by recognizing that enrollees have a payment made on their behalf and the terms of that payment are described by the risk adjustment parameters. There is, thus, a relation between the marginal cost and marginal revenue for each of the services in a plan. Balancing incentives across services essentially amounts to an equation for each service, the level of rationing being the variable and the risk adjustment weights being the parameters.
To equalize incentives in rationing all services, the covariance of the risk adjusted payment with the use of every service must track the covariance of the total predicted costs associated with the increase in use of the service. Intuitively, the optimal risk adjustment formula must have the property that by spending on a service, the cost consequences to a plan relate to the revenue consequences in the same way for all services. It is important to stress that the result for optimal risk adjustment says how a given average payment should be risk adjusted, but does not answer the question of how high or low on average the payment should be.
The optimal risk adjustment emerges as a set of linear equations one for each service, with unknowns equal to the variables available for risk adjustment. An interesting feature of this optimal risk adjustment scheme is that the number of parameters available for risk adjustment could be greater or less than the number of services a plan is deciding about. (Some risk adjustment systems have scores of weights.) If the number of available risk adjustment parameters is larger than the number of services whose quality the plan decides on, there may be many risk adjustors that achieve optimality in the sense of incentive balance across services.
This observation raises the question: Among the ways to set risk adjustment to achieve efficient incentives, which way is best? A natural way to answer this question is to reintroduce the original statistical objective of risk adjustment, best fit. In an earlier paper, the authors show that conditions describing efficient service provision are linear in the risk adjustment weights. These can be introduced as constraints on a least squares risk adjustment regression. This risk adjustor is referred to as the minimum variance optimal risk adjustment (MVORA). It is minimum variance by properties of least squares estimators, and it is optimal because the linear constraints on incentives for efficient service provision are satisfied.
Application To Managed Competition And Enrollee Premiums
Risk adjustment is recognized as an integral part of managed competition policy, with the general objective of making sure plans are willing to accept and serve ailing expensive enrollees as well as healthy low cost enrollees. Managed competition policy also relies on premiums paid by enrollees. If competition is to have its desired effects, plans that are able to provide good care at a lower cost, or provide worthwhile benefit enhancements, need to transmit incentives to consumers through premium competition. If a plan has a better product that consumers are willing to pay for, the logic goes the plan will be able to charge an incremental premium and attract enrollment.
Premium-based incentives are an integral part of health plan payment in the US in two important emerging health policy contexts – the Medicare Advantage (MA) program and Medicare Part D offering private plans in Medicare, and the new state-run ‘Exchanges’ created as part of the Affordable Care Act (ACA) – plan payments come from two sources at once: risk-adjusted payments from a Regulator and premiums charged to individual enrollees. Premiums also play a role in the Netherlands and Germany, though again important institutional details describe the relationship.
Here the authors consider a general setting of a premium support policy in which a Regulator has a budget to pay plans, and has the ability to risk adjust that budget. In addition to risk adjusted payments, plans must also collect revenue from enrollees through premiums. How should a Regulator set risk adjustment weights if only part of the funding for plans is coming through public budgets and being risk adjusted, and the balance will be set by plans in a managed competition market?
Suppose the Regulator collects some public funds to pay plans, and must risk adjust 75% of costs based on age, gender and previous diagnoses. Enrollee premiums must cover the other 25%, and premiums are conditioned on another, possibly overlapping set of variables, age, smoking status, and geography. The key insight is that the risk adjustment mechanism adopted by the Regulator affects premiums, because what a plan would want to (from profit-maximization) and would be able to (due to competition) charge enrollees as a premium depends on how the Regulator sets risk-adjusted payments. ‘What happens’ in this plan market, from a number of perspectives, depends on how these premiums work out. The Regulator needs to consider the effect of the risk adjustment on premiums as part of the answer to how to set risk adjustment weights. The Regulator’s problem in the case of premiums conditioned on several variables differs from the case when the Regulator has the same budget but premiums are to be the same for everyone.
The first step is to describe how risk adjustment weights affect premiums. Let the total number of people be N and health care costs of individual i be xi. People vary in two observable dimensions, according to health status, the basis of risk adjustment, and according to another set of characteristics the authors refer to as personal, the basis of premiums. Health status is indexed by h, h=1,y,H; personal characteristics are indexed by t, t=1,y,T. For notational simplicity, it is assumed that each of these categorizations is one dimensional and the information is mutually exclusive so that each person is characterized by an (h,t) pair the authors will refer to together as a ‘type.’
Define xht to be the average cost of person of type (h,t), and nht to be the number of people of type (h,t). Health care costs are plan costs (which must be covered by plan payments) and are fixed (do not depend on risk adjustment or premiums). The risk adjusted payment by the Regulator can only depend on h:rh. The premium can only depend on t:pt. It is assumed that competition among health plans forces premiums to be zero-profit, meaning, for each premium category, t, the premium for that category is determined by the following condition:
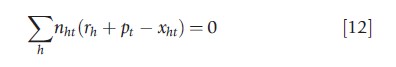
Equation [12] shows how premiums depend on risk adjustment weights. There are T of these expressions, one for each premium category. In each expression there are H parameters, the risk adjustment weights on category h. The authors now move on to the consideration of a second step in a managed competition context, choosing the risk adjustment weights in light of the presence of premiums in plan payment. There are many applications dependent on the objectives of the Regulator. The authors begin with the most basic.
Suppose the Regulator seeks to maximize fit of the payment system with respect to choice of the risk adjustment weights rh on the H health status factors, subject to a perperson budget for risk adjustment and subject to how the market will set premiums to be zero profit conditional on risk adjustment, described in eqn [12].
In general, maximizing an objective of the Regulator involving premiums subject to eqn [12] can be addressed as a problem in mechanism design, setting the payment parameters (risk adjustment weights) to maximize the objective subject to the constraints. The budget constraint on risk adjustment is one linear constraint. The set of linear equations in eqn [12] are also constraints. It is important to note in this regard that the constraints in eqn [12] are equivalent to the so-called normal equations in least squares with respect to premium variables. Thus, a least squares regression in which premium categories are added as variables and the Regulator’s budget is added as a constraint will find the risk adjustment weights that lead to the best fit (by properties of least squares).
One could also change the objective of the Regulator, introducing concerns for efficient service provision as discussed in the earlier application. Premium support policies raise other issues as well. For enrollees to sort themselves efficiently across plans, the premiums’ differences they face should be close to the cost differences they would impose on the plans. This efficiency objective could also be expressed as a set of constraints on premiums.
Final Comment
The most basic implication of economic analysis of risk adjustment is this: When considering design of any mechanism to deal with problems of adverse selection, the nature of the underlying inefficiency and an anticipation of how plans and providers react to the policy should provide the foundation for the analysis. This observation implies that ‘conventional’ approaches to risk adjustment are not in general optimal, and encourages researchers and policy makers to consider alternatives. To design an efficient risk adjustment payment scheme, one needs to know how plans/providers/patients will react to it. Economic theory can help shed light on this question, but ultimately, plan behavior is a matter of empirical research.
References:
- Breyer, F., Bundorf, M. K. and Pauly, M. V. (2012). Health care spending risk, health insurance, and payment to health plans. In Pauly, McGuire and Barros (eds.) Handbook of health economics, vol. 2, pp. 691–762. Amsterdam: Elsevier.
- Cutler, D. and Zeckhauser, R. (2000). The anatomy of health insurance. In Culyer, A. and Newhouse, J. (eds.) Handbook of health economics. Amsterdam: North-Holland.
- Ellis, R. P. and McGuire, T. G. (2007). Predictability and predictiveness in health care spending. Journal of Health Economics 26(1), 25–48.
- Enthoven, A. and Kronick, R. (1989). A consumer-choice health plan for the 1990s. New England Journal of Medicine 320, 29–37.
- Glazer, J. and McGuire, T. G. (2000). Optimal risk adjustment of health insurance premiums: An application to managed care. American Economic Review 90, 1055–1071.
- Glazer, J. and McGuire, T. G. (2002). Setting health plan premiums to ensure efficient quality in health care: minimum variance optimal risk adjustment. Journal of Public Economics 84, 153–173.
- Glazer, J. and McGuire, T. G. (2011). Gold and silver plans: Accomodating demand heterogeneity in managed competition. Journal of Health Economics 30(5), 1011–1019.
- Newhouse, J. P. (1996). Reimbursing health plans and health providers: Selection versus efficiency in production. Journal of Economic Literature 34(3), 1236–1263.
- Van de Ven, W. P. and Ellis, R. P. (2000). Risk adjustment in competitive health plan markets. In Culyer, A. and Newhouse, J. (eds.) Handbook of health economics. Amsterdam: North Holland.