This article covers a number of measurement issues which arise in Health Economics. The first of these arises when economists wish to make comparisons between populations on the basis of some measure of health, h, where hi refers to the value of the health measure for individual i. Such comparisons may be between different populations at the same point in time, or between the same population at different points in time, or indeed a combination of the two. In some cases it may be desirable to compare some measure of central tendency, such as the mean, μh.
In some cases however, there may also be of concern about how this health measure is distributed throughout the population. This may arise, for example, because the underlying individual utility function is increasing and concave in the health measure, hi (presuming for the sake of exposition that a higher value of the health measure increases utility) or it may arise because the ethical views of society are such that society has a degree of ‘inequality aversion’ with respect to the distribution of this health measure. In the latter instance the inequality aversion of society will be reflected in the way in which individual utility functions are aggregated into some measure of social welfare. In both cases social welfare (defined as some aggregate of individual welfare) will be sensitive to both the level and distribution of h.
In either case, comparison of the health measure will be influenced by the precise utility and/or social welfare function employed, because this will determine the relative importance attached to the average value of the health measure and its distribution. This can be problematic, because the ranking of any two populations may well be sensitive to the choice of specific utility/welfare function. This is where the issue of dominance becomes relevant. Intuitively, a dominance result is obtained if it can be demonstrated that the distribution of health in one population, P will always be ranked better (in terms of conferring higher welfare) that the distribution of health in population Q, for all welfare functions which obey certain broadly agreed upon properties. Dominance results are powerful in that they permit fairly unambiguous comparisons to be made between populations, where the term ‘fairly unambiguous’ is used in the sense that the ranking between the populations would hold for a wide range of welfare functions. Below, more formal, specific, definitions of dominance are given but for the moment the aforementioned explanation will suffice.
Where dominance is not found, then analysts must rely upon comparisons of some measure of central tendency, usually the mean or the median. If distribution is also an issue they must rely upon the specific utility/welfare function or, if the focus is solely upon distribution then specific inequality measures must be used, in either case running the risk that the ranking of populations may be sensitive to the choice of function/measure. In the case of health however, there may be a further complication. Some health measures are cardinal (e.g., life expectancy) and thus lend themselves to comparison via the mean and also via well-known inequality measures such as the Gini coefficient or coefficient of variation. In many cases however, the health measure is not cardinal but instead is ordinal and categorical, for example, self-assessed health (SAH). In such cases, analysts have essentially two choices: They can either transform their data from ordinal to cardinal, and then proceed using the cardinal approach referred to earlier. Alternatively, they can employ measures which are specifically designed to deal with ordinal data, bearing in mind, however, that there are relatively fewer such measures to choose from than in the case of cardinal data. The case of data which is measured in intervals lies somewhere in-between. Analysts have the choice to convert interval data into cardinal data by assuming that all observations within an interval take the range of, say, the median of that range. Of course, this be an overly strong assumption to make and ignores any within interval variation, though it may be acceptable if the intervals are comparatively narrow. An alternative would be to convert interval data into cardinal data using the interval regression approach described later.
In this article, the application of dominance methods and the measurement of inequality in health economics, for the case of both cardinal and ordinal data, are reviewed. First, the case where the health measure is cardinal is considered. In the discussion which follows, it can be noted that what could be termed ‘pure’ health inequality, i.e., inequality in health without References: to an individual’s socioeconomic resources will be discussed. This distinguishes this review from the extensive literature on inequality in health outcomes with respect to income or other measures of resources. The article concludes with a brief discussion on statistical inference.
Dominance And Health Inequality With Cardinal Data
In analyzing issues of dominance and inequality in the case where health is measured cardinally, the results and methods employed in the case of income inequality are available for use. It is probably easiest to deal with the case of inequality first. In what follows it is assumed that comparisons between two populations are made with respect to a measure of health hi where it is assumed that higher values represent better health.
The primary dominance concept in the analysis of inequality is Lorenz dominance. This involves comparison of the Lorenz curve for hi for the two populations. The Lorenz curve orders individuals in increasing order of hi and then plots, against the cumulative proportion of the population so ordered, the cumulative proportion of total health going to each proportion of the population. The graph corresponding to the 45° line represents complete equality – everyone has the same health. The closer the graph is to the 45° line, the more equal are the distributions. Thus if one distribution lies above (nearer to the 45° line) for all values of p then that distribution is said to Lorenz dominate and would be ranked as more equal by all inequality measures obeying certain basic properties. These properties are anonymity (permutations of health among the population do not matter for overall inequality), population (the measure of inequality is independent of the size of the population), relativity (absolute levels of health do not matter for inequality measures), and transfer (inequality must fall if there is a transfer of a unit of health from a more to a less healthy person).
Where Lorenz dominance is found, the issue of inequality is essentially resolved. However, it is frequently the case that dominance is not found, in which instance specific inequality measures must be used. There is a wide range of such measures. Among the most frequently used are the Gini coefficient, the coefficient of variation, and the entropy family of measures. The Gini coefficient is closely related to the Lorenz curve and can be calculated as the ratio of the area between the Lorenz curve and 45° line of perfect equality to the area of the triangle below the 45° line. A more formal expression for the Gini coefficient is

i.e., the sum of all the differences between all pairs of health normalized by dividing by the squared population, where N is the total population and μh is the mean of the population health.
The coefficient of variation can be obtained from the expression
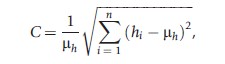
i.e., the standard deviation of health divided by mean health.
The entropy family of inequality indices are given by
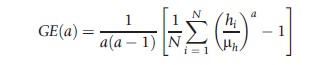
where notation is as before and the parameter a reflects the weight attached to inequality at different parts of the distribution. More negative values of a reflect a higher weight on the lower part of the distribution, whereas higher positive values reflect a greater weight on the upper part of the distribution.
A further additional property which may be desirable in an inequality measure is that of decomposability. Suppose the population can be clearly partitioned into groups, for example, by region, then the overall inequality index can be decomposed into inequalities within regions and inequalities between the regions. The only commonly used inequality index which can be exactly decomposed (in the sense that the sum of the within group inequalities and between group inequalities exactly add up to overall inequality with no residual) is the Theil index (one of the entropy family above, with a = 1).
Lorenz dominance is concerned with comparing health in two populations purely on the basis of inequality, without any References: to the average level of health. From a social welfare perspective, greater inequality of health may be a trade off for a higher average level. To take an extreme example, suppose in population Q, there is complete equality of health, whereas in population P, there is a high degree of inequality, yet the least healthy person in P has higher health than the average level in Q. Many would regard P as having superior health to Q even though Q Lorenz dominates P.
In these instances, stochastic dominance results can be applied. The degree of stochastic dominance will depend upon whether the data are cardinal or ordinal and also on the nature of the underlying utility function. For example, with first-order stochastic dominance, suppose that the cumulative distributions of health in populations P and Q are given by Fp(h) and FQ(h), respectively. Then distribution P dominates distribution Q if for any value of h, FQ (h) ≥FP(h), i.e., for any value of health, h, the fraction of population with health lower than h is less in P than in Q. Alternatively, suppose there is a monotone nondecreasing function of h, u(h), then P dominates Q if ∫u(h)dFp≥∫u(h)dFQ for all values of h. In this case, u(h) can be regarded as a utility function which is monotonically increasing in health.
Thus if it is simply assumed that individual utility is increasing in health, then dominance for population P over population Q holds if the cumulative distribution of health for population P first-order stochastically dominates that for population Q.
Assuming that individual utility functions are not only increasing, but are also concave in the measure of health, then provided the health measure is cardinal, dominance may also be observed if the cumulative distribution of population P second-order stochastically dominates that of population Q. Thus, ∫u(h)dFp≥∫u(h)dFQ and now u(h) is monotone increasing and concave. In terms of the comparison of cumulative distribution functions, what is now important is the area under the distribution functions. Thus P will secondorder stochastically dominate Q if DQ(h)=∫u(h)dFp≥∫u(h)dFQ =DP(h). Note that comparison of the areas under the distribution function implies that h, the argument of the distribution function, can be summed in a meaningful way. This implies that second and higher order stochastic dominance is only meaningful if h is cardinal and cannot be applied if h is ordinal. It is also worth noting that in this case second-order stochastic dominance is equivalent to what is known as Generalized Lorenz dominance, where the Generalized Lorenz curve is simply the original Lorenz curve scaled up by the average level of health.
There is one further branch of dominance theory which is of relevance for comparison of some specific health measures between populations. In some cases, it would be of concern if the value of a specific health measure lies above (or below) a critical threshold, although at the same time, it may not be of concern should the value of the health measure be below (above) that threshold. This has clear parallels with the study of poverty and dominance results from the poverty literature can be applied in these cases. One obvious area within health economics where such techniques could be applied is obesity, with its focus on individuals whose body mass index (BMI) lies above a critical threshold. This approach is particularly useful when there may not be complete agreement over where the critical threshold should be drawn. A further example of an application of this technique in health economics is with regard to mental stress (Madden, 2009). Here mental stress is measured via a Likert scale derived from answers to the General Health Questionnaire (GHQ) and once again the threshold value of the scale which indicates mental stress is open to question. Stochastic dominance techniques are used here to show that regardless of where the threshold is drawn, there was a fall in mental stress in Ireland over the 1994–2000 period.
The analysis of mental stress in Ireland referred to earlier essentially interpreted the Likert scale derived from the GHQ as a cardinal measure of mental health. Strictly speaking this is not true as the underlying data used to construct the scale are of an ordinal categorical nature. Much health data, including the frequently encountered SAH measures, are of this nature and the application of dominance techniques and the calculation of inequality in these instances raise particular questions, to which we now turn.
Dominance And Inequality With Ordinal Data
Whereas there are some health measures which are cardinal, they tend to concentrate only on specific dimensions of health, for example, BMI. More general cardinal health measures are comparatively difficult to come across. Measures such as the SF-36 or Euroqol are available only for a limited range of countries. Probably the most frequently employed measure of general health is SAH. Individuals answer a question of the form: In general, how good would you say your health is? The possible answers are: very bad, bad, fair, good, and very good (the exact wording can differ from survey to survey but it is generally of the aforementioned type). Whereas this measure appears to be a good indicator of overall health it is not cardinal, and with only five categories, it is not suited to the application of the standard inequality indices referred to earlier.
The breakthrough in analyzing inequality with such data came from Allinson and Foster (2004). They showed how standard measures of the spread of a distribution which use the mean as a References: point, such as the Gini, are inappropriate when dealing with categorical data. This is because the inequality ordering will not be independent of the (arbitrarily chosen) scale applied to the different categories. In this instance a more appropriate References: point is the median category and the cumulative proportions of the population in each category is the foundation of their analysis of inequality with categorical data. This is because, whereas changes in the scale used will affect the width of the steps of the cumulative distribution, the height of the cumulative distribution is invariant to the choice of scale, thus providing the crucial property of scale independence.
Allison and Foster (2004) thus develop a partial ordering based on a median-preserving spread of the distribution (analogous to the partial ordering based on a mean preserving spread provided by say a Lorenz comparison). Thus, suppose a measure of SAH with n different categories which can be clearly ordered 1,…, n. Let m denote the median category and let P and Q denote two cumulative distributions of SAH with Pi and Qi indicating the cumulative proportion of the population in category i, in each distribution, where i = 1, …, n. For the case where both P and Q have identical median states m then P has less inequality than Q if for all categories j<m, Pj≤ Qj and for all j≥m, Pj≥Qj. What this is effectively saying is that distribution Q could be obtained from distribution P via a sequence of median-preserving spreads.
Allison and Foster also deal with dominance when the focus is on the level of the health measure. In this case distribution P will dominate distribution Q if the cumulative frequency at each point on the ordinal scale (as we go from lower to higher) is always higher in Q than in P. This is equivalent to the first-order stochastic dominance condition referred to earlier. For a recent example of an application of this approach to a comparison of SAH between different social classes, see Dias (2009). As pointed out earlier, it is important to note that when data are ordinal then second-order stochastic dominance is not defined, because it requires that the health measure h can be summed in a meaningful way.
Of course, the Allison–Foster measure shares with Lorenz dominance the property that it only provides a partial ordering and there may be instances when the aforementioned conditions do not hold and it is not possible to rank different distributions of categorical data. Abul Naga and Yalcin (2008) address this issue and build upon the Allison–Foster approach in presenting a parametric family of inequality indices for qualitative data. Like its cardinal data counterparts such as the Gini coefficient or coefficient of variation, it will always provide a ranking, but it lacks the generality of the dominance approach. Subsequent to the Abul Naga–Yalcin paper, Lazar and Silber (2011) have provided an alternative index for ordinal data building upon work in the area of ordinal segregation. The Abul Naga–Yalcin work has also been extended to provide an index which can be used to make comparisons when the two distributions in question do not have the same median category.
The aforementioned contributions show that real progress has been made toward measuring inequality in the case of ordinal data. However, at this stage, in the literature there is still only a limited number of indices specifically designed for ordinal data, so, unlike the case with cardinal data, the analyst has less opportunity to check the sensitivity of results to alternative indices. In this instance, there is another approach which can be taken. It is possible to transform ordinal data to cardinal data, and then apply the cardinal indices referred to earlier.
Much of the literature in this area developed in the context of measuring health inequality related to socioeconomic resources and a very useful summary is available in van Doorslaer and Jones (2003). Their favored approach is to use interval regression to obtain a mapping from the empirical distribution function of what is regarded as a valid index of health (such as the McMaster Health Utility Index (HUI)) to SAH. By mapping from the cumulative frequencies of SAH categories into an index of health such as the McMaster HUI it is possible to obtain upper and lower limits of the intervals for the SAH categories. These can then be used in an interval regression to obtain a predicted value of the index for all individuals. Comparisons which they carry out for measures of SAH in Canada suggest that this approach to cardinalization outperforms other approaches and it also appears to be the case that the values of the health index obtained are not very sensitive to the cutoff points chosen. Hence it may be regarded as acceptable to use cutoff points from the Canadian HUI to calculate a cardinal index of health for other countries.
A key question then is, how do the results obtained from such an approach compare with those from an index specifically designed to deal with ordinal data? Madden (2010) carried out such an exercise, calculating ordinal inequality indices using the Abul Naga–Yalcin approach and also cardinal indices using generalized entropy measures and applying them to Irish data for the years 2003–06. In terms of the ranking of the different years there was very little correlation between the ordinal and cardinal indices. This is a specific result obtained with a specific dataset but it underlines that the choice between the application of an ordinal index versus transforming data into cardinal format and then using a cardinal index may not be trivial.
Statistical Inference
Sections ‘Dominance and Health Inequality with Cardinal Data’ and ‘Dominance and Inequality with Ordinal Data’ outlined approaches for the testing of dominance and measuring inequality, using both cardinal and ordinal data. Should dominance be found then of course, it is necessary to check if such a finding is statistically significant. Similarly, it may be used for the calculation of the standard errors associated with any particular index of inequality calculated.
Dealing first with dominance in the case of cardinal data, in the case of inequality alone this issue boils down to checking for statistically significant differences between the ordinates of the Lorenz curves. Suppose that Li is the ith Lorenz ordinate (i = 1, 2,..k), where the kth ordinate is equal to one. Then, as shown in Beach and Davidson (1983), given estimated Lorenz ordinates from two populations P and Q with sample sizes NP and NQ respectively, there are k-1 pairwise tests of sample Lorenz ordinates:
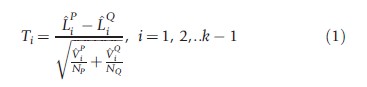
In large samples, Ti is asymptotically normally distributed. Bishop et al. (1991) suggest the following criteria when testing for Lorenz dominance: If there is at least one positive significant difference and no negative significant differences between Lorenz ordinates then dominance holds. Two distributions are ranked as equivalent if there are no significant differences, whereas the curves cross if the difference in at least one set of ordinates is positive and significant although at least one other set is negative and significant.
In the case of first- and second-order stochastic dominance for cardinal data, Kolmogorov–Smirnov tests can be applied. Such tests can also be applied to ordinal data for first-order stochastic dominance.
If Lorenz dominance is not found then individual inequality indices must be calculated and the appropriate standard error obtained. Obtaining analytic expressions for standard errors in the case of many inequality indices is far from easy as the expressions may be highly nonlinear and whereas asymptotic results may exist, robust, small-sample results are more difficult to obtain. Given this problem, the bootstrap approach may be preferable, as evidence suggests that bootstrap tests perform reasonably well in these situations (see Biewen, 2002).
In the case of the ordinal inequality index developed by Abul Naga and Yalcin to date there has been no progress in terms of statistical inference for this index. However, the Lazar–Silber paper provides jackknifed standard errors and it is also worth observing that in the related literature of the measurement of polarization for ordinal data expressions for the calculation of confidence intervals for such measures have been produced.
Conclusion
This article has summarized some of the main results with respect to dominance and inequality in the case of health data. It was seen that a crucial distinction must be made between cardinal and ordinal health measures. In general the literature for cardinal health measures is more developed, in terms of dominance, indices, and statistical inference. There have also been developments in the analysis of dominance in more than one dimension. The area of multidimensional dominance raises important issues for the measurement of population health which are currently being vigorously debated in the poverty literature. One of the principal issues to be resolved is whether aggregation of different dimensions of health should take place before dominance or inequality analysis is applied (e.g., if single-dimensioned dominance/inequality analysis were to be applied to an aggregate cardinal health measure such as the SF-36), or whether alternatively an explicitly multidimensional approach is adopted whereby analysis is applied to separate dimensions of health and aggregation which takes place at the level of the inequality index itself.
For the case of ordinal health measures, which are arguably more widely employed, dominance results are generally less applicable, there are fewer inequality indices and statistical inference is less well developed. In this area, future developments are perhaps most likely to involve further contributions along the lines of Lazar and Silber (2011) with the development of a wider menu of inequality indices. It is also to be expected that further progress will be made in the area of statistical inference.
References:
- Abul Naga, R. H. and Yalcin, T. (2008). Inequality measurement for ordered response health data. Journal of Health Economics 27, 1614–1625.
- Allison, R. A. and Foster, J. (2004). Measuring health inequality using qualitative data. Journal of Health Economics 23, 505–524.
- Beach, C. and Davidson, R. (1983). Distribution-free statistical inference with Lorenz curves and income shares. Review of Economic Studies 50, 723–735.
- Biewen, M. (2002). Bootstrap inference for inequality, poverty and mobility measurement. Journal of Econometrics 108, 317–342.
- Bishop, J. A., Formby, J. and Smith, W. J. (1991). Lorenz dominance and welfare: Changes in the US. distribution of income, 1967–1986. Review of Economics and Statistics 73, 134–139.
- Dias, P. R. (2009). Inequality of opportunity in health: Evidence from a UK Cohort Study. Health Economics 18, 1057–1074.
- Lazar, A. and Silber, J. (2011). On the cardinal measurement of health inequality when only ordinal information is available on individual health status. Health Economics 22, 106–113.
- Madden, D. (2009). Mental stress in Ireland, 1994–2000: A stochastic dominance approach. Health Economics 18, 1202–1217.
- Madden, D. (2010). Ordinal and cardinal measures of health inequality: An empirical comparison. Health Economics 19, 243–250.
- Abul Naga, R. H. and Yalcin, T. (2010). Median independent inequality orderings. University of Aberdeen Business School Working Paper Series, vol. 03, pp 1–25, Aberdeen: University of Aberdeen Business School.
- Apouey, B. (2007). Measuring health polarisation using self-assessed data. Health Economics 16, 875–894.
- Atkinson, A. (1987). On the measurement of poverty. Econometrica 55, 749–764.
- Kakwani, N., Wagstaff, A. and Van Doorlsaer, E. (1997). Socioeconomic inequalities in health: Measurement, computation and statistical inference. Journal of Econometrics 77, 87–103.
- Madden, D. (2012). A profile of obesity in Ireland, 2002–2007. Journal of the Royal Statistical Society A 175, 893–914.
- Van Doorslaer, E. and Jones, A. (2003). Inequality in self-reported health: Validation of a new approach to measurement. Journal of Health Economics 22, 61–87.