Diagnostic imaging uses noninvasive devices to visualize internal human anatomy and physiology. In higher-income, developed economies of the world there is enormous variation in the use and rate of growth of use of diagnostic imaging technology like computed tomography (CT). Even in high use jurisdictions like the US there is a large variation. Compared to other Organization for Economic Co-operation and Development (OECD) countries, the most recent percapita use rates in the US for CT and magnetic resonance imaging (MRI) are more than twice the median OECD rate. There are also substantial geographic variations among the Medicare regions – with the highest per-capita rate of noninvasive imaging in the Atlanta region being 150% greater than Seattle, the lowest use region (Parker et al., 2010). Rapid growth and extreme and variable utilization rates suggest that there may be a lot of inappropriate diagnostic imaging use in the US, and this is especially of concern given that it has relatively poor population-level health indicators among the OECD countries. Inappropriate use has health and economic consequences, which from an economic perspective can be framed as questions of static efficiency and dynamic efficiency. The former is about obtaining good value of money in current spending, and the latter is about eliciting the optimal rate of innovation given the substantial global fixed costs of research and development (R&D). And they are related in that current spending provides the funds needed to support R&D for the long term.
Some characteristics of diagnostic imaging as a medical product – such as strong economies of scale for high fixed cost equipment, informational asymmetry between providers and patients, and the potential for moral hazard – create obvious challenges to promoting its efficient use. For the majority of imaging applications, the marginal cost is relatively low, leading patients and their doctors to seek the information even if the marginal health benefit is low. However, marginal cost pricing would neither cover the fixed costs of the equipment nor provide sufficient funds for long-term dynamic efficiency. However, fee-for-service (FFS) average cost pricing may induce providers to increase volumes to cover the fixed cost, providing incentives for greater use of imaging rather than lesser use – whether the use is appropriate or not. Between 2000 and 2010, physician fees for diagnostic imaging in US Medicare population grew by more than 80%, targeting attention on diagnostic imaging (Medicare Payment Advisory Commission (MedPAC), 2012). Different countries have tried very different approaches to controlling use and costs – discussed elsewhere – the focus here will be on structural economic incentives in the US marketplace and related evidence – such as cost-effectiveness studies, appropriate use strategies, health spending trends, and the impact of payer policies. Finally, designing reimbursement policies that will support appropriate utilization and stimulate levels of innovation consistent with dynamic efficiency is discussed.
The Role Of Diagnostic Imaging In Healthcare Delivery
Diagnostic imaging is clearly about reducing uncertainty when diagnosing health conditions. Over the past 120 years, the major ‘modalities’ of diagnostic imaging (Table 1) have become essential components of medical care. Early innovation in imaging was linked to the advent of radiographic imaging (X-ray) in Germany in the 1890s and the introduction thanks to French scientists Pierre Curie and Paul Langevin of ultrasound in the 1940s and 1950s. The so-called ‘advanced imaging technologies’ were created in the 1970s by Hounsfield in the UK and Cormack in the US with CT imaging or computed axial tomography, again in the 1990s by Bloch and Purcell in the US with MR or MRI, and during the late-1990s by Townsend and Nutt in the US with the nuclear medicine innovation of positron emission tomography (PET) and combined PET/ CT imaging.
Imaging can be used in many ways in healthcare delivery. Imaging can inform healthcare decision-making to assist inpatient planning and management, or can be used with interventional procedures (which are not discussed here). Imaging can be used only once or multiple times during the process of making decisions about using specific medications, procedures, surgeries, or other treatments. The resulting information helps the managing physician to refine the diagnosis to support better overall clinical decision-making. This information can increase the likelihood that the patient will ultimately receive the appropriate stream of treatments in order to reduce morbidity and mortality. But the diagnostic test information can also increase the physician’s and patient’s confidence in the chosen course of clinical action. This can add valuable comfort and peace of mind for the patient. This benefit has been called the ‘intrinsic value’ or the ‘value of knowing,’ and can undoubtedly be important to patients and their providers.
Imaging testing relies on a complex mix of specialized labor and capital, information technology (IT) applications, and processes of communication in ordering and reporting. The high-cost equipment producing high-quality images may provide clinical utility through accurate information for treating providers if the scans are ordered, performed, and interpreted appropriately. From an economic perspective, appropriate use would generally be defined as use for which the long-term marginal social benefit exceeds the long-term marginal social cost. Clinically, the goal has been to use a ‘correct test, correct indication, and correct timing for the correct patient.’ Although it seems likely the majority of use would be found to be appropriate, identifying, and measuring the amount and consequences of inappropriate use is difficult but important. Nonetheless, as will be described below, many of the market and policy responses observed in the US in the past decade represent efforts to control or limit inappropriate use.
Overview Of The Market For Diagnostic Imaging
The market for diagnostic imaging is about the demand for and supply of information. All of the various modalities provide the managing physician – i.e., the patient’s agent – with additional information to reduce diagnostic uncertainty and therefore to enhance the probability of successful treatment. It is, thus, a derived demand from the patient’s point of view, but it is also an imperfect good, subject to some testing and diagnostic inaccuracy. Also, imaging can be subject to considerable moral hazard if neither the patient nor physician face substantial direct monetary consequences. From the supply side, equipment with high fixed and high operating costs are involved, and also complementary services are provided by the radiologist or other interpreting physicians. Throughput in imaging interpretation can be very high (e.g., 7–8 scans read per hour), and the short-run and long-run marginal cost can be fairly low (e.g., the average US payer reimbursement amounts can be on the order of less than US$100 for an X-ray, US$200–300 for a CT scan, and US$400–500 for an MRI). None of these alone would be sufficient to warrant the purchase of catastrophic insurance protection by patients. Still, this equipment represents major investments for most health systems or providers, and many national health systems control their acquisition and deployment. However, in the US, a healthcare system where many insured patients have first-dollar insurance and tax-subsidies for insurance purchase at the margin, it is easy to understand the potential for moral hazard, when the out-of-pocket cost for patients (i.e., often approximately 20% of reimbursed amounts) is far below marginal social cost.
Supply Of Equipment: Cost, Location, And Regulation
Imaging manufacturing has a relatively high fixed cost of entry, but the marketplace includes a mix of diversified large global firms, medium-sized innovative cross-industry firms, and smaller niche firms specializing in specific equipment with more focused applications for different conditions. The global market for advanced imaging equipment is substantial – on the order of US$5 billion per year. Manufacturers have an incentive to produce equipment at a quality level that their customers (hospitals, outpatient centers, and physician offices) find sustainable: i.e., given the reimbursement level, the customers can recover their investment and be in a position to upgrade equipment to be competitive in their local provider market. Given that advanced imaging modalities, such as CT or MRI machines, may have a useful life of 5–10 years, individual customers do not purchase new equipment each year, but manufacturers offer improved software upgrades. The larger manufacturers also provide lease/purchase arrangements, financing mechanisms, imaging software, bundled contracting for multiple purchases, and service contracts, effectively reducing the transparency of specific imaging equipment purchase arrangements, and presumably allowing some price discrimination among buyers.
Imaging providers are located in three main locations: hospital facilities, physician offices or clinics, and independent diagnostic testing facilities (IDTFs). Emergency departments are most often connected to hospitals and usually have dedicated imaging equipment available, but may share resources with the hospital-based inpatient providers. The principal manufacturers are located in Germany (Siemens), the UK (Philips), and the US (General Electric).
Imaging devices are costly and require major investments on the part of health systems. Less advanced imaging equipment, such as ultrasound or analog X-ray machines can range from US$25 000 to more than US$100 000, with the most advanced digital radiography equipment costing several hundred thousand dollars. CT equipment costs may be closer to US$1 000 000, whereas new MRIs and PET/CT scanners can cost US$2 000 000 or more. Service contracts with vendors usually add approximately 8–10% of the purchase price. Countries with national health systems must make major, central financing decisions about purchasing and allocating imaging equipment. In the US, imaging equipment purchases are made by private and public institutions with limited federal guidance or restrictions. The US system is more decentralized, with for-profit and nonprofit hospitals acquiring equipment independently, along with health maintenance organizations (HMOs) and outpatient facilities, such as IDTF. Other more centralized systems use a more publicly reported, transparent planning approach to imaging equipment acquisition.
The regulatory hurdles for new diagnostic imaging devices differ substantially from those of pharmaceuticals and are generally less burdensome. In the US, the Food and Drug Administration oversees safety and efficacy standards for both medical devices and drugs. Devices are categorized as either class I, II, or III, which align with specific premarket authorization notification requirements, or the 510(k) process, as well as with demonstrating that good manufacturing practice compliance standards are met. The class III devices are generally considered higher risk and thus have higher evidentiary standards for manufacturers to meet – more similar to innovative drugs. For lower-risk devices, such as ‘next generation’ diagnostic imaging equipment that is similar to older models and has relatively marginal modifications, diagnostic equipment suppliers can add innovative features or updates with a limited regulatory evidence requirement: clinical trials are not required.
Demand For Imaging: Moral Hazard And Asymmetric Information Among Providers And Patients
At the point of care, managing physicians and their insured patients often have a strong incentive to get more information regardless of social marginal cost. The traditional principalagent relationship applies to imaging, with the patient being the principal consumer and the physician agents providing technical expertise (e.g., radiologist and ordering provider). The size of the market and the complexity of selecting which test is appropriate and choosing how to interpret images have led to further technical subspecialization among imaging professionals, for example, cardiologists also read scans. Patients often have little knowledge of how imaging works technically and/or which modality, such as CT, MRI, or ultrasound, would be most appropriate for a particular condition. This provides an opportunity for radiologists to gain rents for providing their technical expertise for test appropriateness and test interpretation. Physician preferences may increase further imaging in cases where initial testing is not definitive, as indicated in a radiology report or through a sequential testing strategy by ordering providers – though payers place constraints on this, as described below.
Patient demand can also lead to higher rates of medical imaging. Patients are becoming more informed and more active in making their healthcare decisions. Although patients rely on their providers as agents with technical expertise, they are more frequently engaging their providers with information obtained from their networks, the internet, or other sources. Given the influence of third-party insurance payments, because patients do not incur the full cost of imaging services, they may not have a strong copayment disincentive to not be tested. Shifting more financial responsibility to patients in the form of higher copayments for higher-cost imaging, such as for MRI, is being used in some US health systems.
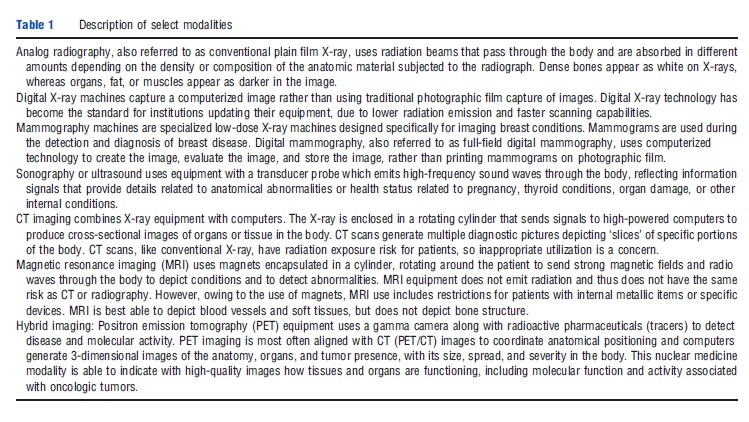
Some observers see physician-induced demand as a factor in this market, particularly when providers have some ownership of the equipment that they are referring patients for imaging. This is, however, a more general phenomenon that links the increased use of healthcare services to physicians having a financial incentive to provide care, whether in the form of more office visits, conducting testing, or performing invasive procedures. In the US, this is generally called selfreferral and has been a focus of attention by researchers and the government. Figure 1 shows the change in specialty practice revenue estimated to come from diagnostic imaging, comparing 2000 with 2006. Imaging by cardiologists and vascular surgeons had the largest increase. Expenditures for imaging associated with self-referral are discussed further below.
Finally, the highly litigious US medical practice has been cited as a contributing factor to providers requesting more imaging, other things equal. Health systems, hospitals, outpatient clinics, and emergency departments may perform more imaging than is clinically or economically appropriate due to concerns of lawsuits and fears of misdiagnosing or under diagnosing a condition without imaging. Although it is difficult to prove that not conducting an imaging test is a wrongful act, providers and systems are at some risk and may choose to image more patients to protect against legal consequences. Tort reform has been suggested by medical professionals as needed to reduce defensive imaging. Smith-Bindman et al. (2011) assessed diagnostic imaging tests of the head in an emergency department setting in 10 US states with varying medical malpractice laws. They found that states with more reforms restricting monetary payments from lawsuits against providers or reforms limiting legal fees had a reduced usage of neurologic imaging.
Fee-For-Service Payment And Incentives
Market incentive structures are a key issue when assessing the behavior of providers and the use of diagnostic imaging. In the US, providers are largely reimbursed under the FFS system, creating a limited incentive to reduce the number of imaging tests being conducted, or to put strong mechanisms in place to increase the proportion of appropriate imaging performed and to reduce more inappropriate scans. In general, the FFS model applies most directly to outpatient imaging, where a technical (facility) fee is charged, along with a professional fee charged that is linked to work-related relative value units, which serves as a proxy for intensity of provider services used and physician time allocated for a particular service. In addition, for imaging in outpatient, emergency department, and inpatient settings, insured patients most often will be responsible for a copayment associated with imaging services, whereas self-pay patients (uninsured) will be expected to pay the full associated charges with limited ability to negotiate reduced payments. The US system used for current Medicare and non-Medicare reimbursement for diagnostic imaging services is essentially a side product of a system designed primarily to reimburse physician services: the Resource-Based Relative Value Scale. Payment, assigned thorough 9600 Current Procedural Terminology codes, is divided into three parts – physician work, practice expenses, and professional liability – and is adjusted geographically. Approximately 600 of the codes apply to diagnostic imaging, although a small portion of these comprise the majority of use and cost to payers.
Medical charges for imaging services are also not closely tied to actual value delivered, rather tend to be based on expected average cost. Reimbursement amounts for Centers for Medicare and Medicaid Services (CMS’s) are often determined through the use of resource use surveys completed by provider facilities, which provide estimates for the amount of time and intensity of resources used to provide a particular service, whether using an older piece of imaging equipment or a newer model. Rates for specific modalities and anatomical regions are modified regularly by CMS as well as by other payers, and can increase or decrease from year to year. It is not immediately obvious whether reimbursement for a particular imaging test or imaging modality would be profitable for a particular facility because it would likely vary by patient subgroup.
Incentives for inpatient imaging in the US may discourage imaging because hospitalizations are reimbursed using assigned diagnosis-related groups (DRGs) based on hospital discharge diagnoses and other factors. The DRG system reimburses hospital providers using a standard ‘lump sum’ payment per DRG for the hospital stay, with variation based on complication-related modifier codes. In general, in-hospital providers or individual practitioners requesting imaging tests may not have a strong incentive to reduce inpatient imaging for their own patients. The hospital administration, of course, has an incentive to control costs, but subject to professional norms and legal risks: they may seek to promote the appropriate use of imaging.
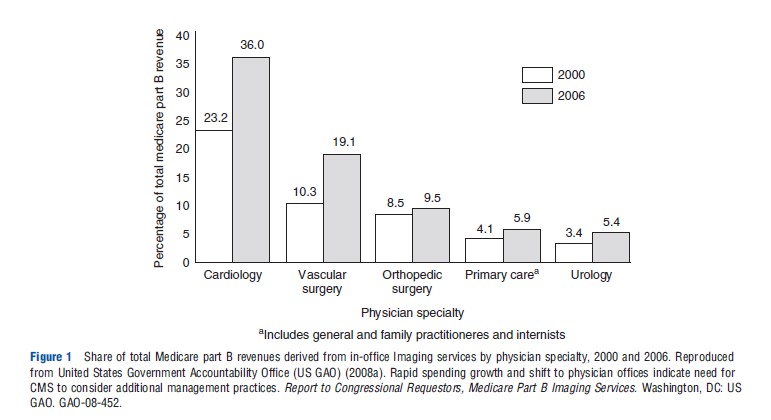
Modifying payment models is a centerpiece of US health reform and health system experiments. As an alternative to FFS in the US, many HMOs use salary-based models for compensating providers, which is likely to reduce direct financial incentives associated with ordering and conducting imaging studies at these institutions. Rather than paying non-HMO physicians on a salary basis, the US is experimenting with episode-based payments or bundled payments for outpatients, requiring coordination among multiple physicians or groups of providers. These models are expected to be a standard of reimbursement in the near future, at least for specific procedures and patient types. Simple examples of bundling imaging payments are payer policies that combine reimbursement for performing multiple imaging procedures at a lower total amount for imaging procedures that are often conducted together (e.g., 75% of time used simultaneously), rather than reimbursing for each imaging test separately. However, these strategies still do not reimburse based on value delivered: they are cost-based approaches based on utilization metrics (Figure 2).
Economic And Comparative Evaluations Of Imaging Appropriateness
This section begins with a discussion of issues to consider in thinking about an economic framework for analyzing imaging appropriateness. Then, two general groups of evaluations are discussed, in turn: (1) economic evaluations, including cost-effectiveness analyses, and (2) comparative effectiveness research (CER).
An Economic Framework For Evaluating Imaging Appropriateness
The assessment of imaging appropriateness faces several challenges common to devices in general. Drummond et al. (2009) assessed differences and similarities for medical devices compared to pharmaceuticals. They identified six primary differences: (1) many devices are diagnostic and do not provide final outcomes, (2) randomized controlled trial (RCT) data are more limited for devices compared to pharmaceuticals, partly due to rapid innovation, (3) device efficacy is in part determined by the device user, (4) there may be more extensive health system impacts for devices, such as training or infrastructure needs, (5) generally less comparative evidence is available for devices, and (6) dynamic pricing flexibility may be greater in device markets due to continuous new product introductions.
Most of these differences also apply to diagnostic imaging specifically. The intermediate nature of diagnostic imaging as informing the referring physician decision-making produces even more challenges for evaluation. Diagnostic scans occur in the middle of the value stream of healthcare delivery, which implies that measuring direct impact on patient outcomes depends on the choice of subsequent interventions. Imaging is more distal to patient outcomes compared to pharmaceutical or surgical interventions. Partly owing to less restrictive regulatory requirements, imaging manufacturers are able to bring new models of scanners to the market with relative frequence, most often without evidence from RCTs. Clinical trials in imaging are often smaller in size and have restrictions in generalizability due to new innovations being introduced during the study. Patients are not likely to enroll in RCTs where they may not be assigned to an arm with the diagnostic test, or the newest test available. All of these challenges contribute to lower levels of evidence for diagnostic imaging modalities.
Fryback and Thornbury (1991) provided an oft-cited hierarchical model for assessing levels of ‘efficacy’ in relation to diagnostic tests, with higher levels associated more closely with outcomes and economic metrics. The initial assessment for a test should focus technical efficacy (image quality) in Level 1. Once a test has shown good technical performance, Level 2 assesses diagnostic accuracy, sensitivity, and specificity associated in specific patient groups and the interpretation of their scans. Level 3 evaluates the impact on diagnostic thinking or modifications to the diagnostic plan of the referring provider. If diagnostic testing introduces a change in treatment planning, Level 4 assesses the impact on the patient management plan by the ordering provider. Level 5 efficacy measures the impact on patient outcome, including survival, morbidity, and quality-of-life-metrics. If costs and resource constraints are considered, Level 6 would assess societal efficacy of resources used by evaluating costs and benefits or cost-effectiveness from a societal perspective.
A central feature of imaging is the strong capital and labor interaction that influences whether a test is effective for its intended use. The equipment should produce an accurate image and the radiologist should be able to provide a correct interpretation. However, more advanced and complex imaging tests may have associated imaging artifacts or incidental findings that require a determination on whether it is appropriate to conduct follow-up testing, related to Fryback and Thornbury’s Level 3, where diagnostic testing findings can lead to more diagnostic testing. Likewise, lesser trained or lesser experienced radiologists, cardiologists, or other specialists conducting imaging may not interpret scans correctly, or may not be able to provide meaningful summaries of imaging findings, thus providing limited guidance to referring physicians. More advanced imaging equipment and more complicated medical scans will require greater levels of skilled providers to produce the imaging result and interpretation, thus potentially more controls on appropriate use. Newer molecular imaging studies or advanced cardiovascular studies require attenuation correction for image quality and References: points to allow more precision in specific anatomical positioning, and skilled technologists, radiologists, IT personnel, and physics teams are needed to complete accreditation requirements and monitor equipment.
To evaluate the clinical impact and resource use implications of imaging, a model is usually needed to simulate the use of the testing strategy, as well as downstream impacts from either false positives or false negatives. For example, false positives may lead to unnecessary biopsies being conducted for verification. Likewise, imaging may occur for exploring indeterminate results or incidental findings. False negatives from imaging may also have serious health consequences: patients may not receive needed treatments which could lead to disease progression with adverse clinical and/or economic impacts. Therefore, understanding the likelihood of sensitive and specific results from a diagnostic testing strategy and the follow-up implications is essential in estimating the comprehensive impact of diagnostic test use.
The identification of and follow up of incidental findings observed on imaging studies, meaning those not related to the primary condition of interest for obtaining the diagnostic imaging test, can lead to high resource use and high anxiety on behalf of patients. Establishing the costs and health consequences of incidental findings is a critical issue for imaging practice. These variable outcomes not only add complexity to conducting economic evaluations, but also are affected by health system and provider practice variations. Concern about legal liability may influence providers to follow up these findings more aggressively.
Economic Evaluations Including Cost-Effectiveness Analysis
Economic evaluations of diagnostic imaging address a range of different issues and involve a variety of assessment approaches. These analyses study: (1) diagnostic test utilization patterns, referral patterns and imaging, (2) impacts on use after introduction of decision support systems, (3) trends for specific conditions, and (4) the cost-effectiveness of particular diagnostic strategies in defined subpopulations. The data sources include observational studies, retrospective reviews, prospective studies, and secondary database analyses. As noted, imaging studies may result in findings that require further testing to more conclusively determine if patients have a condition or not. Clinical studies may not capture these comprehensive sets of events that occur due to diagnostic imaging, and retrospective analyses are suboptimal due to a limited availability of health status data or clinical information. For a variety of reasons, medical record data and resource use data are often not connected electronically.
Cost-effectiveness analysis (CEA) and cost-utility analysis (CUA) are important tools to assess the potential appropriateness of imaging interventions. Their growth has paralleled the growth in imaging spending and payer requirements to demonstrate value for expenditures. Cost-utility studies generally estimate cost per quality-adjusted life-years (QALYs) gained (a combined time and quality-of-time metric). In 2008, Otero and colleagues evaluated 20 years of cost-effectiveness studies for radiology (1985–2005), providing an assessment of 111 published CUAs. During this period, there was an increase from a few CUAs each year to approximately 10 per year. Nearly 80% of the CUAs they identified pertained to diagnostic radiology. They summarized studies by modality and disease/condition. Ultrasound and angiography were the most frequently studied imaging tests, followed by MRI and CT. The five most frequently assessed disease areas were peripheral vascular disease, cerebrovascular disease, ischemic heart disease, musculoskeletal and rheumatologic disease, and lung cancer. Importantly, approximately 80% of studies used secondary data from the literature to estimate quality of life ‘utility scores’ for the QALY estimation rather than primary data collection. This highlights the need for more comprehensive prospective studies to assess the economic impact of imaging on patient outcomes.
Most economic evaluations of diagnostic imaging have estimated the marginal effects of imaging interventions on particular types of patients by comparison with alternative testing strategies. The incremental costs and consequences associated with using health resources for one condition or type of medical test can be compared with those costs and outcomes from using other tests, and potentially compared among conditions. To date, the number of well-designed imaging evaluation studies is still very limited. The clinical scientific imaging literature has predominantly focused on diagnostic accuracy characteristics and comparisons. Recently, more incremental cost-effectiveness studies of imaging are being conducted and published. But these studies face considerable challenges in sorting out the heterogeneity associated with estimating cross-population or cross-indication effects associated with implementing diagnostic testing guidelines.
Economic assessments can be conducted at a health system level as well as for a typical patient with a health condition. Consider a policy that tries to encourage adherence to findings from a diagnostic test that indicates a low likelihood that a surgery would improve a patient’s morbidity or mortality status. This could result in fewer surgeries of that type being performed, thereby reducing the aggregate number of surgeries expected to have suboptimal outcomes and lower cost. Likewise, a diagnostic test that leads to additional testing, treatments, or procedures may result in other patients not receiving specific procedures or care, particularly in systems with a fixed health budget. Therefore, a comprehensive assessment of the economic impact on the health system of using a diagnostic test should include these direct and indirect effects. Practically speaking, however, few, if any, economic assessments of diagnostic imaging interventions have taken a comprehensive societal perspective.
Establishing A Comparative Framework For Appropriateness
In recent years, there have been calls for more CER in imaging. CER incorporates multiple stakeholder perspectives (e.g., patients, providers, payers, and systems) and attempts to identify those medical products or programs that provide substantial benefits to patients and those that do not. In addition, effectiveness data for patient subgroups are often lacking. In 2009, an Institute of Medicine report provided recommendations on the top 100 national priorities in the US for comparative effectiveness research, citing advanced imaging (CT, MRI, PET, and PET/CT) in oncology as a top-tier priority for additional comparative studies. A total of nine topic areas relevant to imaging approaches were included in the top 100 priorities. Most of these nine areas included recommendations to compare multiple imaging modalities used in specific indications.
Gazelle et al. (2011) suggested a framework – aligned with the Fryback–Thornbury hierarchy – for thinking about CER in diagnostic imaging. They suggest that designing practical evidence requirements for imaging technologies should consider the size of the population at risk for a condition, the likely clinical impact of imaging, and the overall cost impact of diagnostic testing, including the cost of the test, subsequent costs of treatments and testing, and the impact on payers’ budgets. In a market-oriented system such as the US, differences in access to healthcare can affect health outcomes among ethnic, racial, or income groups. The CER initiatives and national priorities identified racial and ethnic disparities as a primary area of US healthcare requiring more comparative evaluations.
Imaging Utilization Management Strategies And Appropriateness Tools
The goal of improving the appropriateness of diagnostic imaging has been addressed in multiple ways by the various stakeholders, including payers, providers, professional societies, and policy makers. Six tools aim to limit overuse and promote efficiency are briefly described in this section: (1) professional appropriateness criteria, (2) radiology benefits management (RBM), (3) clinical decision support (CDS), (4) coverage with evidence development (CED) by CMS, (5) Congressionally mandated, across-the-board reductions in payment amounts, and (6) quality improvement (QI) metrics.
First, imaging appropriateness criteria have been developed by the American College of Radiology. Duszak and Berlin (2012) provide an overview of their rationale and a historical perspective of utilization management. Owing to the overall scarcity of comparative imaging evidence and long-term outcomes studies, these types of criteria often rely on expert opinion, supported by the medical literature when available: they are most often not based on large randomized studies or strict evidence-based clinical guidelines. However, they serve as a guide to using imaging more appropriately, which can reduce testing that does not provide high marginal clinical benefit but does impose cost on the system.
Second, RBM gained momentum in the 1990s as a mechanism to control use and costs, similar to prior authorization requirements for prescribing expensive biotechnology medications. Insurance companies hire RBM brokers to manage their imaging-related benefits, such as in requiring preauthorization for MRI scans or other expensive tests. Although providers argue these systems are restrictive and remove patient-provider preferences from decision-making, assessments have shown a reduction in imaging expenditures related to a ‘gatekeeper effect.’
Third, CDS systems are generally less restrictive than RBMs and are more real-time use oriented at the point of ordering, but require a computerized ordering system. Providers enter patient-level clinical and demographic information, including diagnosis codes, and then request an imaging test. The tools provide an appropriateness score based on an embedded algorithm. Individual imaging managers or health systems can decide how restrictive to make the algorithm and whether to allow all orders to be processed or to disallow imaging tests based on specific appropriateness ranges.
The introduction of RBMs and CDS systems to control imaging requisitions highlights a key point related to imaging use: radiologists do not typically order scans. They traditionally have not served as effective self-regulating providers who perform only appropriate imaging tests based on requisitions; hence, ordering-point controls have arisen.
Fourth, CMS has attempted to control or better understand imaging use though CED. In 2005, a CED approach was used to require enrollment in a registry as a mechanism to restrict coverage and reimbursement for PET and PET/CT scans in oncology indications while more evidence was gathered about this new modality. CED can effectively slow the diffusion of new products and the CED cohort can be linked to utilization claims to evaluate how innovations impact overall utilization.
Fifth, in a broad, national-level effort to control costs, the US Congress passed the Deficit Reduction Act (DRA) of 2005, which included mechanisms to slow the growth of medical spending on Medicare and Medicaid. The law imposed reductions in reimbursement rates for imaging services, as well as allowing states to modify conditions associated with Medicaid programs. At the state level, in particular, access to care for lower-income individuals and families was affected due to provisions allowing states to modify eligibility or documentation requirements, with a goal of saving billions of dollars in the Medicaid program.
Finally, QI metrics are being used by providers, payers, and health technology assessment organizations to directly and indirectly incentivize appropriate care. For example, emergency department throughput reporting is required by CMS, direct cost comparisons for academic medical centers have been added to the University Hospital Consortium, and reimbursement restrictions are being implemented for cardiovascular patients having hospital readmissions within 30 days of discharge. Imaging in inpatients impacts overall efficiency of workflow and net reimbursement for providers, leading hospitals to evaluate imaging use and direct costs relative to other hospitals.
Trends In US Imaging Spending: Growth And Controls
In terms of the growth in imaging spending, the period since 2000 can be divided into two intervals: the period before the DRA of 2005 and the period since then. In the first period, imaging growth outpaced all other medical expenditures, leading to the initiatives described above. In the period 2006–11, imaging growth slowed, and in later years even declined in evaluations of specific payers. Nonetheless, attention to physician ordering patterns and geographic variability continues to be a target for standardization as well as efficiency and appropriateness assessment.
A 2008 report by the US Government Accountability Office (US GAO, 2008a) evaluated use and expenditures for different imaging modalities, including MRI, CT, nuclear medicine, ultrasound, X-ray, and other procedures between 2000 and 2006. They analyzed trends in the number of tests per Medicare beneficiary and the estimated payments for technical and professional fees for imaging per beneficiary. Overall, there was a steady increase in imaging use and payments to physicians in per beneficiary spending. The report also highlighted substantial state-level variability in imaging outpatient expenditures per beneficiary, ranging from less than US$100 per beneficiary to greater than US$400, with Florida and Nevada having the highest levels of per beneficiary spending. The GAO assessment noted a shift in the proportion of physician services paid through physician offices and IDTFs, rather than through institutional outpatient settings of hospitals.
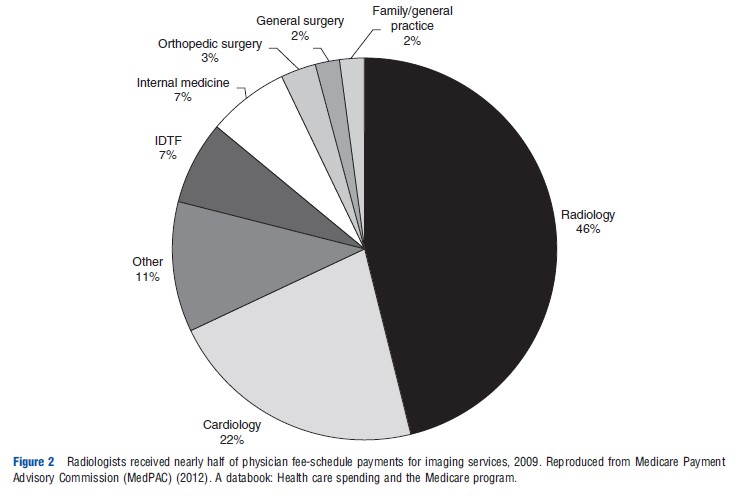
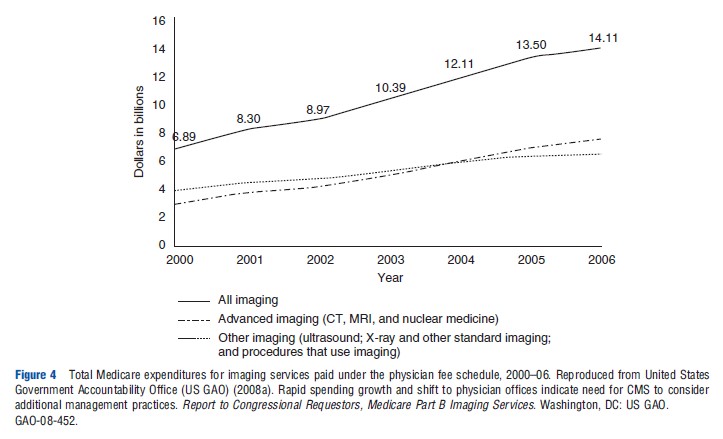
Overall Medicare Part B spending on imaging during this period increased from under US$7 billion to more than US$14 billion, including imaging in hospitals, provider offices, and IDTFs (Figure 3). The overall size of the imaging spending pie doubled, although the allocation of spending shifted more heavily toward nonhospital imaging (Figure 3). These expenditure trends were influenced by higher rates of increases in advanced imaging, such as for CT, MRI, and nuclear medicine (Figure 4).
Levin et al. (2011) assessed Medicare trends in noninvasive diagnostic imaging from 1998 to 2008 and reported steady increases in overall imaging utilization rates during this period. Their assessment of advanced imaging showed that CT rates per 1000 Medicare beneficiaries continued to increase, but MRI and nuclear medicine testing started to level off from 2005 to 2008. A MedPAC assessment of essentially the same time period indicated that the number of head CT increased from 112 per 1000 Medicare beneficiaries in 2000 to 205 per 1000 in 2010. In the same period, all other CTs increased from 258 per 1000 to 548 per 1000 beneficiaries. Overall MRI rates essentially doubled from 2000 to 2010, with MRI of the brain increasing from 45 per 1000 beneficiaries to 79 per 1000, and all other MRIs increased from 64 per 1000 to 141 per 1000 beneficiaries (Medicare Payment Advisory Commission (MedPAC), 2012).
A recent 2012 GAO report evaluated the role of self-referral of imaging services to assess Medicare trends in imaging utilization. As noted earlier, self-referral implies that an ordering provider has an ownership interest in a facility they direct patients to have imaging testing. The report presents the number of CTs and MRIs between 2004 and 2010 for self-referred imaging and nonself-referred imaging. Between 2006 and 2010, nonself-referred MR imaging was associated with a decline in office-based or IDTFs. Self-referred MRIs continued to increase during this same period. For CT services, nonselfreferred imaging increased at a slowing rate between 2004 and 2009, and declined from 2009 to 2010. Self-referred CTs, however, although lower in magnitude, gradually continued increasing throughout the period 2004–10.
Levin et al. (2010) found a decreased effect on outpatient imaging rates in a multistate pre-RBM and post-RBM analysis of a large private insurer introducing this control mechanism. Rates of CTs, MRIs, and PET scans were reduced subsequent to the introduction of increased management of ordering by approximately 10–20% measured as the number of imaging studies per 1000 members. Blackmore et al. (2012) summarized the impact of several imaging utilization programs tested in statewide initiatives, hospitals, and individual health plans. An observed reduction in growth rates for CT scans in Massachusetts General Hospital (MGH) of approximately 10% was greater than the impact on MRI growth, which was negligible. In Minnesota, the Institute for Clinical Systems Improvement (ICSI) coordinated a CDS initiative with five large provider groups, and reported a restriction in imaging growth to nearly zero. In MGH and ICSI, these tools were also used as an education tool for providers consistently ordering less appropriate scans, with an intention of changing behavior. A Virginia Mason CDS tool implemented in Seattle, WA was able to reduce overall imaging rates in target conditions.
A 2008 GAO report estimated the impact of the DRA on imaging expenditures in the Medicare population (US GAO, 2008b). The outpatient prospective payment system cap resulted in fee reductions for approximately 25% of overall imaging tests, with a greater relative reduction for advanced imaging tests. Following DRA outpatient reimbursement rate reductions, overall imaging expenditures per beneficiary decreased by approximately 10% between 2006 and 2007, although the number of total imaging tests per FFS Medicare beneficiary continued to increase.
The overall financial impact of QI initiatives focused on efficiency metrics have likely put downward pressure on costs and potentially have reduced inappropriate imaging, although no comprehensive published studies are available. Several policies have been recently introduced, so there is limited data on the effects of QI programs on expenditures. As the impacts of broader US health reform and QI are studied in the coming years, the impact of cost-focused QI programs will be better understood.
Recently, Lee and Levy (2012) analyzed multiple samples of insured populations and found that annual rates of CT and MRI growth, although increasing fairly rapidly from 2000 to 2006, started to decline after 2006. In some instances, CT utilization per 1000 beneficiaries showed absolute declines in use in 2008 and 2009. Their evaluation of a combined set of 47 health plans indicated a doubling of CT and MRI rates per 1000 plan members between 2002 and 2009, but MRI growth was close to zero from 2006 to 2009. They describe that findings were contemporaneous with general policy trends of increased prior authorization, CDS, RBM, and general economic challenges. Nevertheless, more attention toward appropriateness and utilization strategies – including more attention to CT radiation dose exposure–seemed to contribute to slowing the growth of imaging.
It would, of course, be very difficult to estimate accurately the resulting health impacts on society or to separate the role of each of these influences. It is also difficult to claim causal effects due to any specific payer or government policy related to imaging, but taken as a whole, the attention placed on reducing imaging expenditures since 2005 was associated with at least a leveling off of growth rates and a bending of the cost curve for imaging. However, the US still uses the highest amount of advanced imaging of nearly all countries, spends more on healthcare in general, and does not have adequate structural incentives to encourage substantial reductions in diagnostic imaging. Although imaging is not the highest category of US medical expenditures, more alignment with appropriateness at the point of imaging ordering should improve the static efficiency of use.
Innovation And Dynamic Efficiency
Given the complexities of providing diagnostic imaging in the US healthcare system, it is unclear how much use is inappropriate (i.e., inefficient in a static sense), and it also unclear how much underuse there is for those with access problems. Furthermore, no national estimates are available of the social cost of either overuse or underuse.
In such a second-best world, it is also unclear how close the system is to achieving dynamic efficiency, i.e., eliciting the optimal amount of innovation from a longer-term perspective. Given the lack of hard evidence and estimates, reasoning about incentives may be the best option. In this vein, it has been argued that the lack of value-based reimbursement in radiology is likely to inhibit innovation (Garrison et al., 2011). In theory, fixed payments per scans of different types lead manufacturers to provide a quality level of imaging that is only financially sustainable within that payment limit. Furthermore, it is not clear whether the amount the reimbursement system pays for imaging results is being divided between the capital equipment owners and scan readers (usually the radiologist) in a manner that supports optimal capital innovation. The science behind imaging is a global public good, and the equipment is sold worldwide, including the sale of lower quality or refurbished equipment in developing country settings. Such differential pricing can provide greater support for research and development and counter the incentives in the US that might hinder the rate of innovation.
Conclusion
Advanced imaging modalities have revolutionized medical practice by improving clinical diagnostic ability to meet the goal of having reliable, condition-specific test results to support better decision making. The potential benefits associated with an improved ability to accurately diagnose medical conditions using advanced imaging should be weighed against the resource costs for payers and society in order to assess the appropriateness and efficiency of its use. However, specific features of diagnostic imaging provide unique challenges for economic evaluations. Also, policy attention to imaging use has increased in an effort to target the most rapidly increasing components of medical imaging. Rates of spending growth have slowed since 2007 due presumably to several payer and policy initiatives, but overall imaging spending remains high. Nonetheless, there is clearly a dearth of economic research on either the actual cost-effectiveness of specific imaging applications or on the impact of current reimbursement rules and other market incentives on health system performance. At best, most cost-effectiveness analyses show only the potential value of appropriate imaging in specific applications. Continuing high and variable utilization rates suggest significant overuse in the US. Across-the-board cuts and other utilization controls have curbed spending growth, but the extent of inefficiency – both static and dynamic – remains unclear.
References:
- Blackmore, C. C. and Mecklenburg, R. S. (2012). Taking charge of imaging: Implementing a utilization program. Applied Radiology 18–23.
- Drummond, M. F., Griffin, A. and Terricone, R. (2009). Economic evaluation for drugs and devices – Same or different? Value in Health 12(4), 402–404.
- Duszak, R. and Berlin, J. W. (2012). Utilization management in radiology, part 1: Rationale, history, and current status. Journal of the American College of Radiology 9, 694–699.
- Fryback, D. G. and Thornbury, J. R. (1991). The efficacy of diagnostic imaging. Medical Decision Making 11, 88–94.
- Garrison, L. P., Bresnahan, B. W., Higashi, M. K., Hollingworth, W. and Jarvik, G. J. (2011). Innovation in diagnostic imaging services: Assessing the potential for value-based reimbursement. Academic Radiology 18(9), 1109–1114.
- Gazelle, G. S., Kessler, L., Lee, D. L., et al. (2011). A framework for assessing the value of diagnostic imaging in the era of comparative effectiveness research. Radiology 261(3), 692–698.
- Lee, D. W. and Levy, F. (2012). The sharp slowdown in growth of medical imaging: An early analysis suggests combination of policies was the cause. Health Affairs 31(8), 1876–1884.
- Levin, D. C., Bree, R. L., Rao, V. M. and Johnson, J. (2010). A prior authorization program of a radiology benefits management company and how it has affected utilization of advanced diagnostic imaging. Journal of the American College of Radiology 7, 33–38.
- Levin, D. C., Rao, V. M., Parker, L., Frangos, A. J. and Sunshine, J. H. (2011). Bending the curve: The recent marked slowdown in growth of noninvasive diagnostic imaging. American Journal of Roentgenology 196, W25–W29.
- Medicare Payment Advisory Commission (MedPAC) (2012). A databook: Health care spending and the Medicare program. Washington, DC: MedPAC.
- Parker, L., Levin, D. C., Frangos, A. and Rao, V. M. (2010). Geographic variation in the utilization of noninvasive diagnostic imaging: National Medicare data, 1998–2007. American Journal of Roentgenology 194, 1034–1039.
- Smith-Bindman, R., McCulloch, C. E., Ding, A., Quale, C. and Chu, P. W. (2011). Diagnostic imaging rates for head injury in the ED and states’ medical malpractice tort reforms. American Journal of Emergency Medicine 29, 656–664.
- United States Government Accountability Office (US GAO) (2008a). Rapid spending growth and shift to physician offices indicate need for CMS to consider additional management practices. Report to Congressional Requestors, Medicare Part B Imaging Services. Washington, DC: US GAO. GAO-08-452.
- United States Government Accountability Office (US GAO) (2008b). Trends in fees, utilization, and expenditures for imaging services before and after implementation of the deficit reduction act of 2005. Report to Congressional Requestors, Medicare. Washington, DC: US GAO. GAO-08-1102R.
- Bresnahan, B. W. (2010). Economic evaluation in radiology: Reviewing the literature and examples in oncology. Academic Radiology 17, 1090–1095.
- Duszak, R. (2012). Medical imaging: Is the growth boom over? The Neiman Report, No. 1. Reston, VA: Harvey L. Neiman Health Policy Institute.
- Gazelle, G. S., McMahon, P. M., Siebert, U. and Beinfeld, M. T. (2005). Cost-effectiveness analysis in the assessment of diagnostic imaging technologies. Radiology 235(2), 361–370.
- Hollingworth, W. (2005). Radiology cost and outcomes studies: standard practice and emerging methods. American Journal of Roentgenology 185, 833–839.
- Institute of Medicine (2009). Initial national priorities for comparative effectiveness research. Report Brief. June.
- Levin, D. C. and Rao, V. M. (2008). Turf wars in radiology: Updated evidence on the relationship between self-referral and the overutilization of imaging. Journal of the American College of Radiology 5, 806–810.
- Massachusetts Medical Society (2008). Investigation of defensive imaging in Massachusetts.
- Miller, R. A., Sampson, N. R. and Flynn, J. M. (2012). The prevalence of defensive orthopaedic imaging: A prospective practice audit in Pennsylvania. Journal of Bone and Joint Surgery 94(3), e18.
- Otero, H. J., Rybicki, F. J., Greenberg, D. and Neumann, P. J. (2008). Twenty years of cost-effectiveness analysis in medical imaging: Are we improving? Radiology 249(3), 917–925.
- Pandharipande, P. V. and Gazelle, G. S. (2009). Comparative effectiveness research: What it means for radiology. Radiology 253, 600–605.
- Ramsey, S. (2010). Comparative assessment for medications and devices: Apples and oranges? Value in Health 13(supplement 1), S12–S14.
- United States Government Accountability Office (US GAO) (2012). Higher use of advanced imaging services by providers who self-refer costing Medicare millions. Report to Congressional Requestors, Medicare. Washington, DC: US GAO. GAO-12-966.