A multiattribute utility (MAU) instrument consists of two parts: (1) a health questionnaire, and (2) a scoring formula which converts answers into an overall score. Each set of answers to the health questionnaire defines a ‘health state.’ The overall score reflects the strength of people’s preference for the state, and, consequently, it is a measure of the utility of the state as understood in economics.
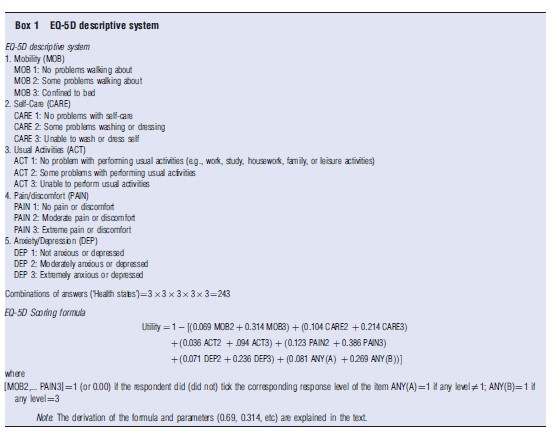
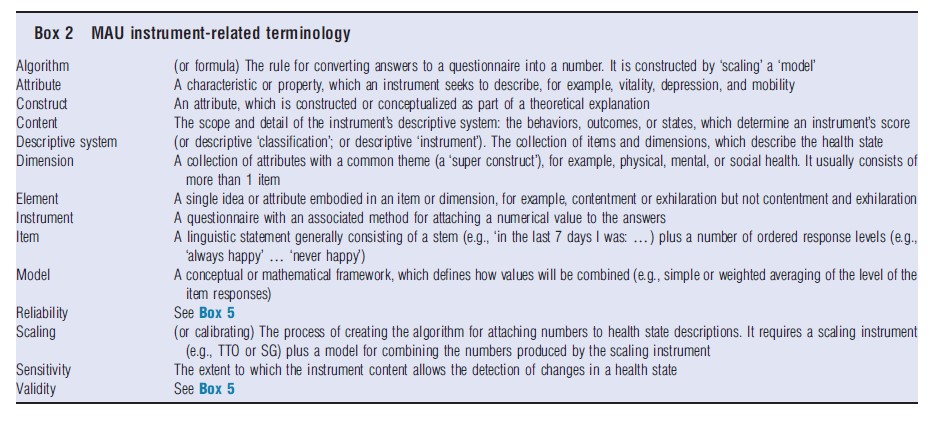
Box 1 illustrates this. The EQ-5D MAU instrument consists of five single ‘items’, i.e. questions and response levels (see Box 2 on terminology). Each relates to a separate dimension of health (mobility, self care, usual activities, pain, and depression), which collectively constitute the ‘descriptive system’ or classification. The instrument combines these using the formula shown below the questionnaire. An individual answering level 1 for each item (1, 1, 1, 1, and 1) would obtain a utility score of 1.00; a person answering (3, 3, 3, 3, and 3) – the ‘all worst’ health state – would obtain a utility score of 0.594. As health states change (because of a health program), answers change, and the MAU instrument predicts a change in a person’s utility. Someone answering (1, 1, 2, 2, and 3) before health care and (1, 1, 1, 2, and 2) afterwards would score 0.225 before and 0.725 after care, an improvement of 0.5.
Utility scores calculated this way may be used for economic evaluation, and, in particular, cost–utility analyses (CUA), which compare health program costs with the number of quality-adjusted life-years (QALYs) obtained. QALYs are calculated by multiplying an index of utility by years of life. The index must be measured on a scale on which 1.00 is ‘best health’ (as defined by the instrument) and 0.00 is the ‘utility’ of death. Consequently, in best health, the number of QALYs equals life years times 1.00 and therefore equals the number of life years. With death, life years times utility equals zero. In the example above, a health program which moves an individual from health state (1, 1, 2, 2, and 3) to (1, 1, 1, 2, and 2) for 10 years, would result in 0.5×10+5 QALYs, which would, in turn, be compared with the cost of the care, to obtain a cost per QALY.
Even when utility scores are not used, MAU instruments are useful for describing changes in health states over time and for comparing the health states of different individuals. In principle, the instrument can also be used to estimate the QALY-based burden of disease. However, this type of analysis has been dominated by the use of disability-adjusted life years, which combine the quality and length of life in a related but different way.
In principle, an MAU instrument can be generic, i.e., applicable to a wide range of health states, or it may be condition-specific and apply to only a specific disease. This article is about generic MAU instruments, and the term ‘MAU instrument’ is used here to refer to generic instruments.
Construction: The construction of an MAU instrument entails three steps. First, ‘items’ must be selected to create the questionnaire (‘descriptive system’ or ‘classification’). Second, individuals are interviewed to obtain numerical data from which their utility – strength of preference – can be calculated for different health states. Third, a ‘model’ is used to attach values (utility scores) to all of the possible health states described by the instrument. The third step is necessary because the number of health states described by an MAU instrument is, generally, too large for the utility of each health state to be evaluated individually. Modeling is therefore used to extrapolate from measurements that are made to all possible health state values.
These steps have been approached differently by different research teams, and the scope and detail of the resulting descriptive systems varies considerably. The numerical data used for predicting utility have been obtained using different ‘scaling’ techniques including the time trade-off (TTO), standard gamble (SG), and the rating scale (RS). Models have employed different econometric techniques, sophisticated averaging, and a combination of these to derive a general formula for predicting utility scores from the numerical data (see section Instrument Use and Acceptance).
MAU instruments are flexible and easy to administer. However, they have their limitations. Their usefulness for evaluation is constrained by the content and sensitivity of the instrument’s descriptive system and by the validity of the utility scores produced by the algorithm.
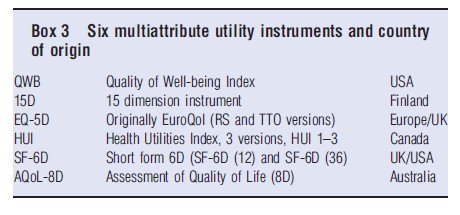
In the following section, six MAU instruments (see Box 3) are reviewed. Their chronology, characteristics, and construction are described and compared in the section History, Description and Construction of MAU Instruments. Section Instrument Use and Acceptance summarizes their use and recognition by health authorities. Different instruments produce different scores, as discussed in the section Comparison of Instruments. The reasons for this include differences in the theoretical traditions adopted in constructing the descriptive systems and scoring formula (section Theory and Evaluation) and differences in instrument content (section Construct and Content Validity). The implication of these differences for the validity of utility scores and therefore for policy is discussed in section Criterion Validity. Challenges to the field are outlined in the concluding section Conclusions. Additional readings are suggested, which contain References: supporting the present text.
History, Description And Construction Of MAU Instruments
Chronology
Figure 1 summarizes the historical development of the six MAU instruments. Most writers in the area commence with a reference to the famous 1948 World Health Organization (WHO) definition of health as a ‘state of complete mental and physical well-being and not merely as the absence of disease and infirmity.’ This legitimized the concept of ‘health’ as a single construct. However, it did not provide a basis for measurement.
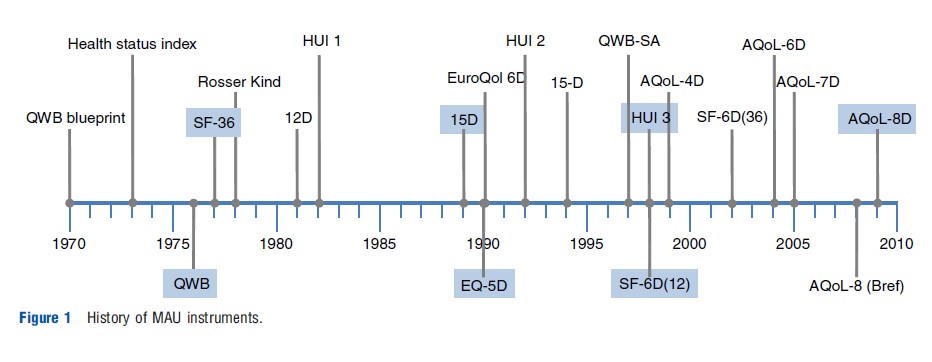
In the USA, the ‘blueprint’ for measurement was published in 1970 by Fanshel and Bush. This provided the theoretical basis for the earliest instruments, the health status index (1973), the Quality of Well-Being (QWB) (1976), and the Short Form 36 (SF-36) (1977). The latter was also the empirical basis for two later UK versions of the SF-6D developed by Brazier, one directly derived from the SF-36 (2002) and one from its reduced form, the SF-12 (2004).
The first UK instrument, the Rosser Index, was initially intended for hospital patients (1972) but was subsequently generalized to a generic 29 health state classification instrument, the ‘Rosser-Kind Index’ (1978). This was displaced by the EuroQol, which was created by a European consortium (The EuroQol Group) formed in 1987. The instrument was subsequently renamed as ‘EQ-5D’ and adopted for general use following creation of a scoring algorithm at the University of York in 1995. Earlier, Sintonen had created the 12D instrument in Finland, and the revised 15D was published immediately before publication of the EuroQol in 1989.
Three Canadian health utility instruments (HUI) were initiated by Torrance in 1982 for the evaluation of neonatal intensive care. These were modified for use in childhood cancer (HUI 2) in 1996 and further developed and scaled by Feeny for the adult population in the HUI 3 in 2002. The Assessment of Quality of Life (AQoL) instruments were developed in Australia by Richardson and Hawthorne. The AQoL-4D was published in 1997 and subsequently modified as the AQoL-6D in 2004. Additional dimensions were added to increase sensitivity for vision (AQoL-7D) in 2005 and for mental health (AQoL-8D) in 2009.
Description Of Instruments
Tables 1–3 compare the six MAU instruments. Two broad conceptual approaches to description have been used (Table 1). Following the WHO typology, health problems result in impairment, disability and handicap; that is, body malfunction, limitations of body performance, and problems affecting life in a social context, respectively. Three MAU instruments (EQ-5D, SF-6D, and AQoL) have based their descriptions primarily on the last concept (i.e. health problems affecting life). By contrast, two MAU instruments (15D and HUI) have adopted a ‘within-the-skin’ approach (impairment/disability), although 15D was modified to include one handicap dimension. The QWB spans all concepts.
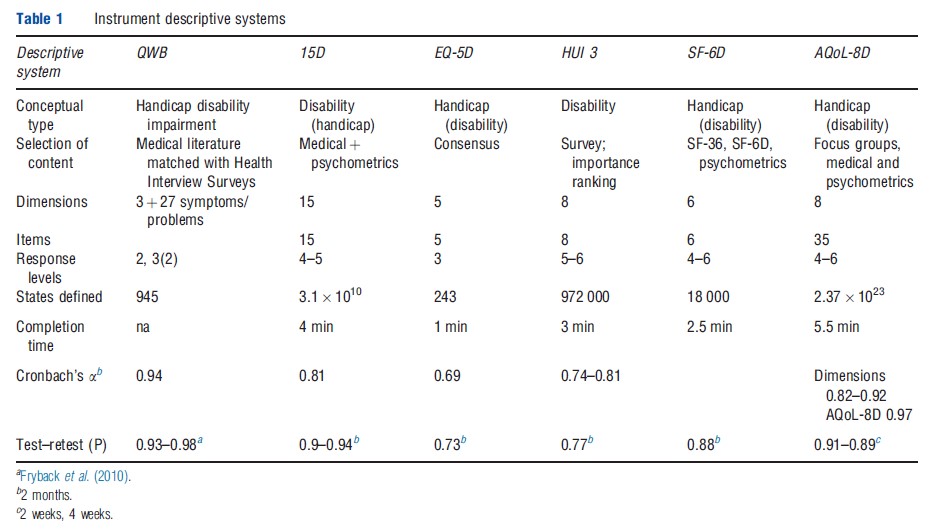
The resulting instruments have between 5 and 15 dimensions, with one item per dimension in the HUI 3, 15D, EQ-5D, and SF-6D and an average of four items per dimension in the AQoL-8D. QWB has three basic dimensions supplemented with 27 ‘symptom/problem’ groups. Items have four to six response levels (e.g. the severity of pain or the level of mobility). Overall, items plus response levels define between 243 health states for the EQ-5D and 2.37 1023 for AQoL- 8D. Larger instruments, particularly AQoL-8D, define numerous ‘empty’ states (e.g., ‘bedridden’ but ‘no problems with self-care’).
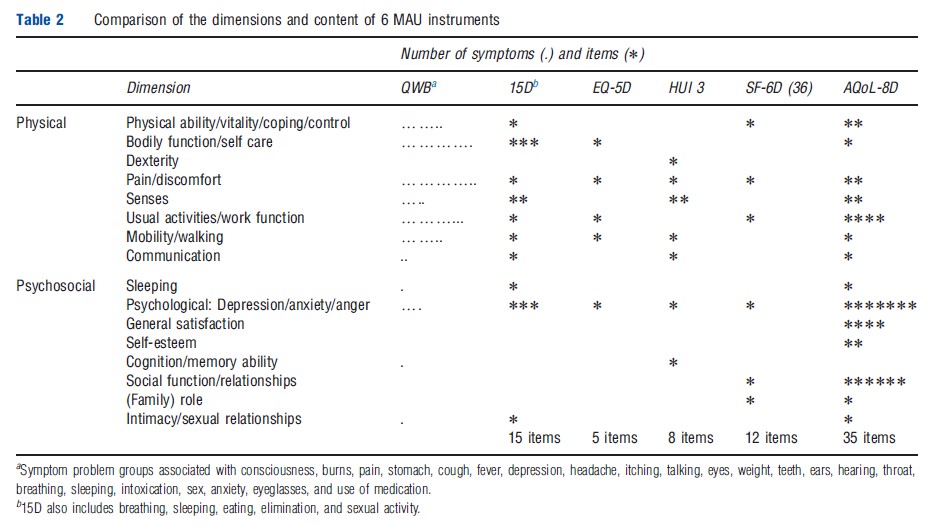
Different instruments include different dimensions (Table 1). Several are unique to a particular instrument and dimensions with similar titles include different items. Consequently, to appreciate the scope (‘content’) of an instrument an examination of the items is required. These are compared in Table 2, which indicates that the scope of instruments varies significantly, in part, because of the differing conceptual bases and, in part, from the level of descriptive detail contained in the items. In principle, instruments with fewer items may indirectly capture the same – or even more – information as the larger instruments by using items with broader descriptions. Alternatively, they may be omitting content to achieve some other goal such as brevity. The differences are potentially important for the validity of the instruments and are discussed further below.
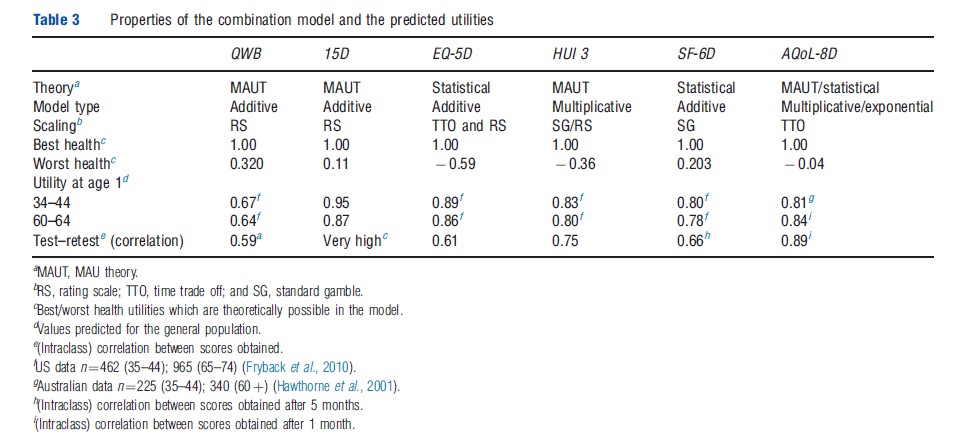
In addition to differences in their descriptive systems, different scaling techniques have been used to measure utilities (in particular, the TTO, RS, and SG) and different models have been used to extrapolate utility scores over the full range of health states (Table 3). Three instruments have adopted models based on MAU theory. Two have used statistical analysis and one (AQoL-8D) uses both techniques (see section Theory and Evaluation). Best health states are described differently by each of the scales, but all assign ‘best health’ a numerical value of 1.00. This implies that 1.00 corresponds with different levels of real utility. The utility of the worst health state varies in the instruments from 0.32 (QWB) to 0.59 (EQ-5D), similarly implying differences in the numerical scale.
Instrument Construction
QWB Index: The QWB descriptive system was derived from the Health State Index Questionnaire. Items for this were selected from 343 ‘core descriptions’ (items) derived from the literature and from existing health surveys.
The three multiresponse items of the QWB (mobility, social, and physical activity) define 47 health states. In combination with 27 symptom/problem groups, this rises to 945 states (Table 1). Although these contain no explicit mental health components, the instrument has been used for patients with psychiatric problems as the general items are sensitive to psychiatric problems. Items were scaled using RS responses from the general population of San Diego (n ¼ 866). An additive model was used in which the disutility from each dimension and from the worst symptom is subtracted from 1.00 (the utility of full health). The distribution of scores for the general population is approximately normal – bell-shaped – with responses distributed symmetrically around a central point. Perfect scores are rare and there are neither significant ceiling nor floor effects – that is, the instrument is sensitive at both ends of the value scale and can discriminate between states close to full health and between very poor health states.
QWB was the first MAU instrument. Originally administered by trained interviewers, a self-administered version (QWBSA) was created in 1997. Translations exist into Spanish, German, Italian, Swedish, French-Canadian, and Dutch. Information and the user manual may be obtained at https:// hoap.ucsd.edu/qwb-info/.
15D: The descriptive system of the 15D is based on a review of Finnish health policy documents. Scores were obtained from a sample of the Finnish population. The instrument has 15 items, 14 relating to disability (mobility, mental function, etc.) and one to handicap (‘usual activities’). The 1981 version was revised following feedback from the medical profession in 1986 and again in 1992 following further user feedback and factor analysis. Utilities were obtained using a RS. Each level of each dimension is given a value and each dimension given an importance weight. Utility is calculated by adding the weighted dimension scores together.
Five separate models were subsequently used to re-estimate utilities. These used published econometric formulae to convert RS values into ‘utility’ scores (n=2500). Results demonstrated convergent validity of 15D values (i.e., the different models produced similar results).
Few people have perfect scores on the 15D, but few obtain scores below 0.4; that is, there are no serious ceiling effects, but the instrument does not identify health states with very low utility scores, at least, as measured by other scales.
The 15D has been modified for children (16D) and has been translated into 25 languages with 4 in preparation. The 15D website is: http://www.15d-instrument.net/15d
HUI 3: The HUI 3 descriptive system is an adaptation of HUI 2 and reflects the importance ranking assigned to a list of 15 symptoms in a Canadian survey of hospital patients. It consists of eight items with either five or six response levels. The ‘within-the-skin’ – i.e. disability based – descriptive system has no explicit social or handicap-based dimensions. An RS was used with 504 residents of Ontario, Canada, and the scores were converted to a SG (utility) equivalent score using an equation (a power function), which was calibrated to predict three SG scores from their corresponding score on a RS.
The HUI 3 model for combining items was based on the assumption of ‘structural independence’ – that is, the assumption that a single attribute is not measured in more than one way (as this will result in ‘redundancy’ or ‘double counting’ of disutility). According to one study, the correlation between items varies between 0.02 and 0.35, which is consistent with the conventional psychometric definition of ‘independence.’ (When item correlation is low, it is assumed in psychometrics that items are picking up different aspects of a construct.) Instead of combining dimensions with an additive model, the HUI 3 employs the multiplicative formula recommended by Decision Analytic (Multiattribute Utility) theory.
The actual formula is deceptively complex and constructed from disutilities. As an example, with a three-dimensional instrument the formula might take the form:
![]()
where 1/1.06 is the scaling constant, and 0.7, 0.6, and 0.5 are dimension importance weights times the scaling constant, U=1-DU. The scaling constant constrains the scale to the range of 0.00–1.00. When the dimension disutility scores for the three dimensions DU1, DU2, and DU3 are all 0.00 (or 1.00), the utility score will be 1.00 (or 0.00).
The utilities predicted by HUI 3 fall below zero (worse than death), indicating the absence of floor effects. However, approximately 30% of scores from the general population exceed 0.95 indicating the likelihood of ceiling effects.
HUI 3 questionnaires are available in English, Chinese, Japanese, Russian, Dutch, French, German, Italian, Portuguese, Spanish, Czech, Polish, Finnish, Norwegian, and Danish. There are sixteen English versions, which differ in their mode of administration, the assessment viewpoint, and duration of assessment period. The website is http://fhs.mcmaster.ca/hug/ EQ-5D: The five item, three level EQ-5D defines 243 health states. It was originally designed as a brief ‘linkage tool’ to be used alongside more comprehensive MAU instruments and to facilitate comparison between studies that had used different instruments. Following the development of preference weights at the University of York, it became widely accepted as a standalone generic MAU instrument and eventually became the preferred instrument of the UK National Institute of Health and Clinical Excellence (NICE).
The UK weights, which are the most widely used, employ TTO data from a survey of 2997 adult members of the general UK population. TTO values were obtained for a number of holistic health states, which were created by combining different response levels from the EQ-5D descriptive system. These were regressed on item levels, and the best fitting regression equation was used to generate a score for all the health states defined by the descriptive system. Linear regression was used, so the final model, as with the QWB and 15D, is additive. Models were created for different sociodemographic groups with eight algorithms estimated using both TTO and RS. However, only the general population TTO formula is normally used (the formula was reported earlier in Box 1). The utilities for the 243 health states can be obtained directly from a table.
The correlation between EQ-5D dimensions varies, typically, from approximately 0.20 to 0.60 indicating structural dependence – that is, some aspects of HR-QoL are picked up by more than one item. However, econometric scaling may, potentially, overcome this problem (see section Theory and Evaluation) ensuring that predicted values and actual values are equal at the mean.
Negative scores are predicted for some of the general population indicating the absence of floor effects. However, approximately 35% of the general population obtain a score above 0.95 indicating the presence of ceiling effects.
The EQ-5D has been translated into 150 languages. A version for children aged 7–12 has been translated into 12 languages. A scoring algorithm has been estimated in the USA and 9 other countries (Belgium, Denmark, Finland, Germany, Japan, the Netherlands, Slovenia, Spain, and Zimbabwe). In 2009, the EQ-5 L, a 5-response level instrument (with the same items) was published and the EuroQol Group executive approved the use of ‘bolt-ons’ to increase instrument sensitivity for particular health states. The website is http:// www.euroqol.org/.
SF-6D: Two versions of the SF-6D instrument are available – one derived from the SF-36, the most widely used generic (nonutility) HR-QoL instrument, and the other from its derivative, the SF-12. Consequently, utility scores may be derived from any study reporting values from these instruments. ‘SF-6D (12)’ and ‘SF-6D (36)’ are similar except for a reduction in the response categories for two items in SF-6D (12), which reduces the number of possible health states from 18 000 to 7500.
The items of the descriptive system of the SF-6D were derived from the factor analysis undertaken in developing the SF-36 and other psychometric evidence.
Utility scores for 249 health states were obtained from 611 respondents using the SG. These were regressed on item levels and the resulting linear equation used to predict utility scores for other health states. The resulting (0.5) formula took the form:
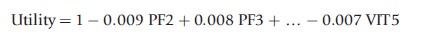
where PF2 and PF3 are the second and third response categories on the physical functioning dimension scale, and VIT5 is the fifth response category on the vitality dimension scale.
Several different models were used to estimate utilities (based on random effects linear regression, rank estimation data, and a nonparametric Baysian approach). The best fitting model predicted a minimum utility score of 0.203. Approximately 5% of the general population obtain scores below 0.5, indicating possible floor effects. In contrast only approximately 8% scored above 0.95, indicating the absence of ceiling effects.
Versions of the instrument have been developed in Australia, Brazil, Hong Kong, Japan, Portugal, and Singapore. More information about SF-6D can be accessed at: http:// www.shef.ac.uk/scharr/sections/heds/mvh/sf-6d.
AQoL: AQoL descriptive systems were constructed from reviews of existing instruments, the HR-QoL literature, from focus groups and ‘construction surveys’. The latter involved administering large numbers of items to selected patients and the public. Factor analyses and structural equation modeling (SEM) were used to obtain a multilevel model. AQoL-8D has 35 items, which combine to form eight dimensions, which, in turn, combine into the two ‘super dimensions’ of physical and psychosocial (‘mental’) health.
Utility (TTO) scores are estimated from a multistage procedure, which employed both the multiplicative model described earlier for the HUI 3 and econometric modeling, similar to the SF-6D (except that exponential net linear models were used).
The estimation procedure has four steps: (1) estimation of dimension from item scores with multiplicative models; (2) econometric correction of these dimension estimates; (3) combination of corrected dimensions into a (single) multiplicative model; and (4) econometric correction of the final multiplicative model.
AQoL-8D used a sample of 712 people aged 18–70 years to construct the descriptive system and a second sample of 628 to obtain TTO scale values (322 patients and 306 public). The scaling survey obtained values for 174 ‘within dimension,’ multiitem health states and 375 multidimensional health states. Transformations have been created between AQoL-4D, 6D, and 8D. AQoL-4D (the original AQoL instrument without the original dimension for symptoms) has been reduced to an 8-item AQoL-Bref or AQoL-8 (which should not be confused with the AQoL-8D).
In a general population, few people score below 0.25, approximately 1.5% have perfect scores, and approximately 14% score above 0.95. Floor effects are therefore closer to 15D and SF-6D than to HUI 3 and EQ-5D, but there are no significant ceiling effects. The AQoL instruments have been translated into traditional and simplified Chinese, Spanish, German, Arabic, Norwegian, and Danish. The AQoL website is: http://www.aqol.com.au/.
Instrument Use And Acceptance
Instrument Use
Information on the use of each of the MAU instruments was obtained from the Web of Science database for the period 2005–10 and supplemented by References: provided to the authors or from the instrument websites. The search identified 1682 studies, which employed at least one of the MAU instruments. These were used to construct Tables 4–6.
Table 4 indicates that EQ-5D was the most popular instrument by a significant margin, with 63.2% of the 1682 studies using it. This was followed by HUI 3 (9.8%) and SF-6D (8.8%). At the other end of the scale, 15D and AQoL were included in 6.9% and 4.3% of studies, respectively, and the QWB, the earliest widely used instrument, accounted for only 2.4% of total use.
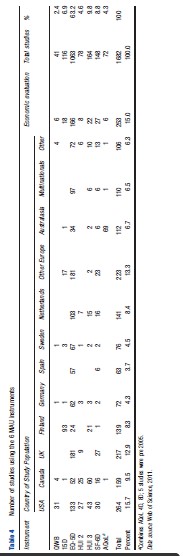
The EQ-5D also dominated use in most countries and was only exceeded in Canada by the HUI 3 and in Finland by the 15D. Table 4 reveals significant ‘local loyalty’ with the use of all instruments peaking in their country of origin. Apart from EQ-5D, only HUI 3 and SF-6D achieved significant use in other countries.
Use of the instruments was also very concentrated. European studies accounted for 55% of the total, and the addition of USA and Canadian studies raises this to 80.5%. Within Europe, use was also concentrated, with Finland and Netherlands each accounting for more than 8% of the total, or double the usage by Germany, despite its much larger population and more than 65% of the usage by all other European countries combined. The extent to which this is attributable to language and publication bias is unknown.
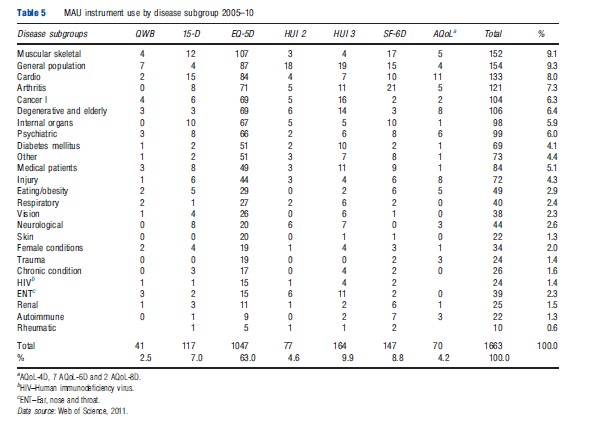
Only 15% of the studies included in Table 4 were primarily concerned with economic evaluation (which need utility scores) as distinct from their use as generic tools for the measurement of HR-QoL (which does not require scores to be ‘utilities’). The disease categories in which they were used are reported in Table 5. This reflects a broad acceptance of MAU instruments across the spectrum of disease categories, possibly reflecting the widespread use of self-reported disease-specific instruments in medicine. Given the scope of the literature search, however, the number of studies published in most of the disease areas is relatively small.
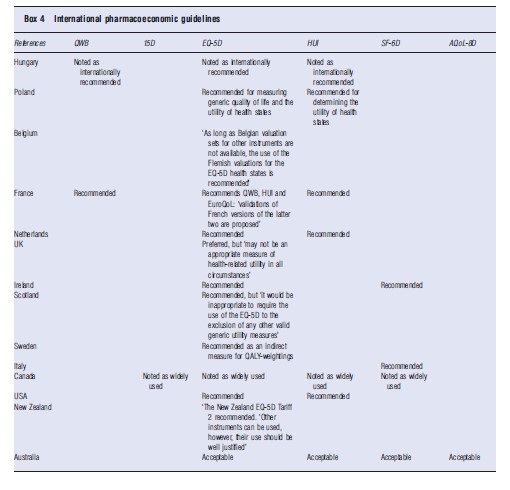
Acceptance By Government Health Authorities
The different instruments enjoy varying degrees of acceptability by health authorities and in national pharmaceutical guidelines. Examples of this are given in Box 4. Each of the instruments has been used in government health surveys. The 15D and AQoL instruments have only been adapted in this capacity in Finland and Australia, respectively.
Comparison Of Instruments
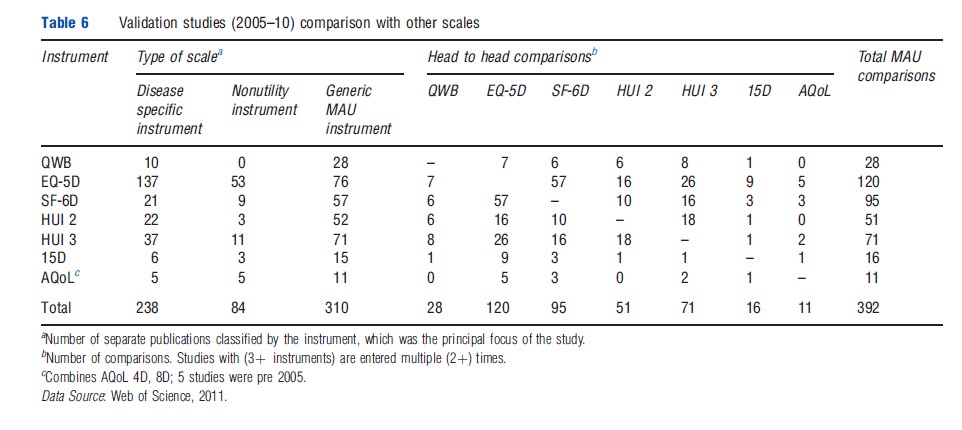
Table 6 reports the number of studies which compare instruments and the head-to-head comparisons between MAU instruments between 2005 and 2010. From the first three columns, the majority of comparative studies involved a disease-specific instrument (238) or a generic nonutility instrument (84). There were 310 comparative studies of MAU instruments. Because these included multi-instrument comparisons, the number of head-to-head comparisons was greater than the number of studies (392). The largest number of these comparisons involved the EQ-5D (120) closely followed by the SF-6D (95) and HUI 3 (71). Comparisons primarily consisted of a Pearson correlation. Intraclass correlation, the preferred statistic even in simple comparisons, was relatively uncommon and psychometric analyses were rare. This is discussed further below.
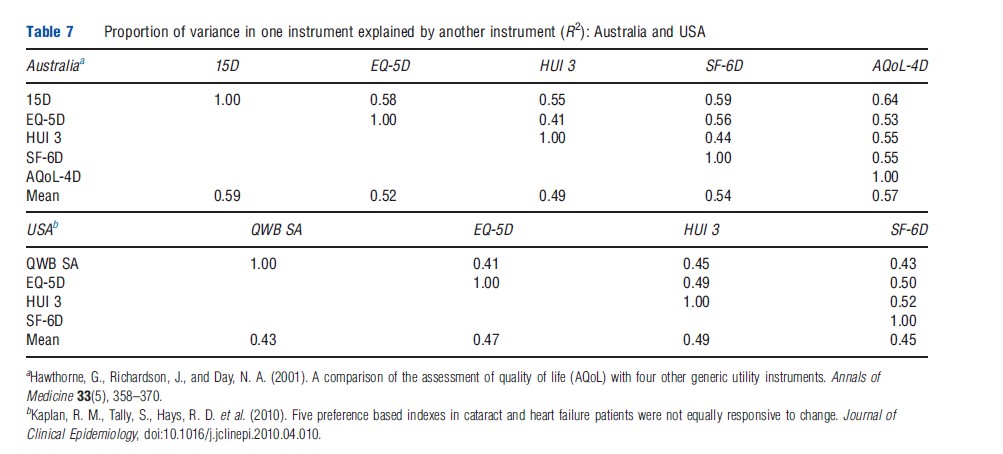
Despite the large number of comparisons between MAU instruments reported in Table 6, only two large and two smaller studies have included five instruments. In an early Australian comparison (Hawthorne et al., 2001), 956 hospital patients and general population respondents were administered the EQ-5D, SF-6D, 15D, HUI 3, and AQoL-4D. The proportion of instrument variation explained by other instruments varied from 41% to 59% leaving an average of 44% unexplained. The highest explanatory power was achieved by 15D, followed by AQoL-4D (Table 7). In a recent US study (Fryback et al., 2010), 3844 adults were surveyed to compare the EQ-5D, QWB, HUI 2, HUI 3, and SF-6D. A weaker association was found than in Australia (reflecting the inclusion of only general population respondents). Overall 53% of instrument variance was not explained (Table 7). Recent work indicates that the strength of the association between instruments varies across the health spectrum.
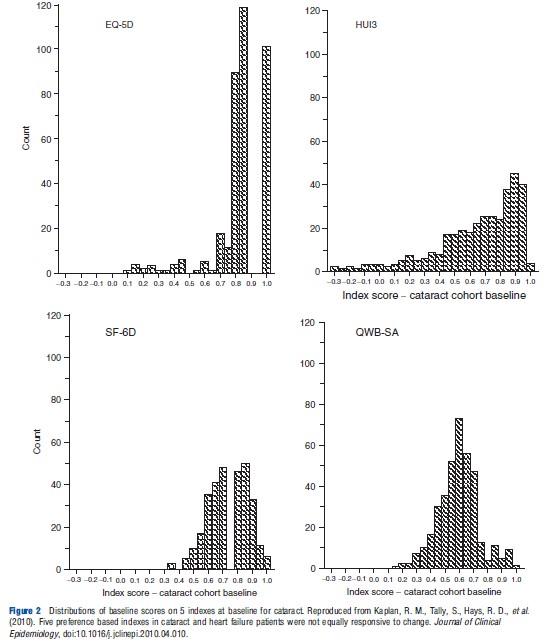
Frequency distributions from the US study are reproduced in Figure 2. As the individuals included in each distribution are the same, the distributions would be identical (subject to respondent or transcription errors) if the instruments were measuring the same construct on the same scale. However, the figures indicate significant differences. A more recent and smaller Australian study (Khan and Richardson, 2011) reinforces this conclusion by creating the pair-wise comparisons of instrument frequencies shown in Figure 3. If the different instruments predicted identical utilities, the points in Figure 3 would lie on the 451 line, i.e., Instrument A=0.00+1.00 Instrument B. This does not occur indicating significant discrepancies in the predicted utilities.
Generally, researchers conducting multi-instrument comparisons have concluded that the utilities derived from the instruments are ‘not equivalent,’ that translation between them will result in ‘low precision,’ and that comparisons between them ‘warrant caution.’
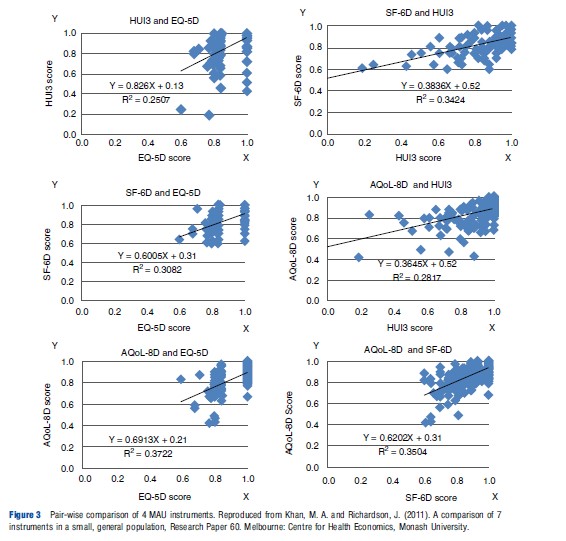
Theoretical reasons for these differences are discussed in section Theory and Evaluation and section Construct and Content Validity. However, one proximate cause is the difference in upper and lower end sensitivity, i.e., in ‘ceiling’ and ‘floor’ effects. For example, in the five-instrument US study cited earlier, the percentages of scores above 0.95 were 37.0 for EQ-5D, 36.9 for HUI 2, 36.2 for HUI 3, 1.7 for SF-6D, and 2.3 for QWB. Figure 3 also reflects the strong ceiling effect of the EQ-5D (the horizontal scale in the three left hand diagrams) and the HUI 3. The SF-6D and EQ-5D have the strongest floor effect(s) with no values below 0.6. The AQoL-8D and HUI 3 had minimum values of 0.42 and 0.04, respectively. Additionally, for each value on one instrument there is significant variation in the value of other instruments (for the same person). For example, when SF- 6D =0.6, HUI 3, and AQoL-8D values varied from 0.25 to 1.00 and 0.55 to 0.95, respectively; when AQoL-8D =0.8, HUI 3, and SF-6D varied from 0.25 to 1.00 and 0.10 to 1.00, respectively. Some of these variation will be undoubtedly random. Some may be attributable to the choice of scaling instrument as TTO, SG, and RS give slightly different values. The remainder must be attributable to the instrument descriptive systems and models.
The variation in instrument scores raises the question of which instruments yield the most appropriate utilities for use in economic evaluation and the appropriate contexts in which they might be used. There is no agreement about this. The theoretical foundations of the instruments are discussed in the next section. Instrument performance and validity is discussed in sections Construct and Content Validity, and Criterion Validity.
Theory And Evaluation
Theoretical Foundations
Present MAU instruments draw on theory from three relatively distinct disciplines: decision analysis (DA), psychometrics, and economics/econometrics. The traditions in these areas are not always consistent, reflecting the context from which they arose. This has received relatively little explicit discussion, possibly because decision analysis and psychometrics have played only a limited role in mainstream economics. Nevertheless, they are of fundamental importance for the methods adopted in the construction of MAU instruments and their validity.
DA: The 15D, HUI 3, and AQoL-8D all seek theoretical justification, at least in part, from MAU theory, a subset of DA theory. This recommends that complex outcomes (in the present case, ‘health states’) should be decomposed into attributes (dimensions) such as pain and vision. Utility scores should be assigned to each of the attributes and a model used to combine attribute utilities into a total utility score.
Importantly, the theory requires that descriptive attributes should be structurally independent. For example, a business model optimizing output as a function of total revenue, total cost, and profit would result in ‘double counting’ as the first attribute is the sum of the other two. Depending on the nature of preference (for the attributes) DA models may be additive, multiplicative, or multilinear. The QWB and 15D assume additive independence. Empirical results for the HUI 3 and AQoL-8D implied the need for multiplicative models.
Psychometric theory: Psychometrics is the basis of measurement theory in education and psychology, which quantifies unobserved ‘constructs’ (such as educational attainment, IQ, and personality). Its potential contribution in the present context is threefold. First, it prescribes methods for constructing instruments; second, it describes criteria for their evaluation; and third, it describes numerous forms of bias and other sources of measurement error.
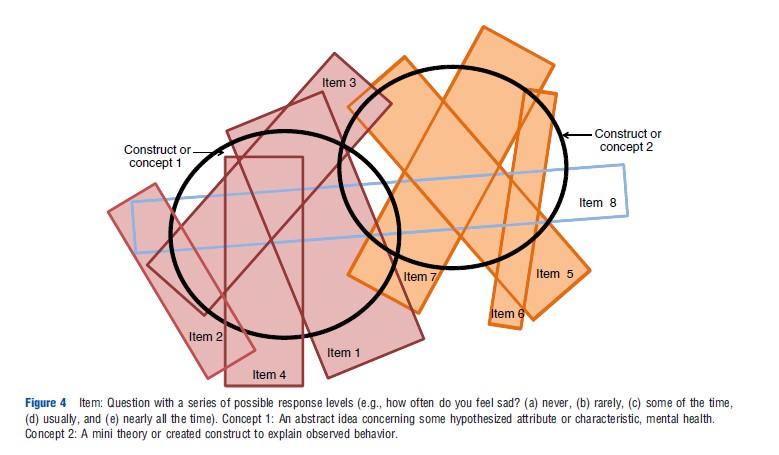
A tension exists between the decision analytic and psychometric approaches. The former requires independence between items and between dimensions to avoid double counting of disutilities. The latter approach assumes that items will correlate to some extent and that the scale for a satisfactory construct requires a minimum of 3 and preferably 4 items for content validity. The reason for this is illustrated in Figure 4. Two constructs are represented by bolded circles and a number of items – linguistic statements – are represented by rectangles. Reflecting the imprecision of language, no one item exactly corresponds with a construct. Items 1–4 are required to measure construct 1 and items 5–7 to measure construct 2. Factor analyses may be used to obtain the efficient set of items and to omit items that ‘cross load’ (item 8). Confirmatory factor analysis or SEM may be used to achieve this goal while forcing the retention of theoretically desired constructs. However, the resulting instrument structure achieves content validity by violating the DA requirement of structural independence, which is needed to avoid the double counting of disutilities. This issue, however, has received little attention.
With the exception of the AQoL instruments, full psychometric analysis has played little or no role in MAU instrument construction. The SF-6D employed psychometric evidence from the SF36 in the selection of items, and the 15D was revised following psychometric analysis. Other instruments selected items by other means (see section History, Description and Construction of MAU Instruments). One explanation offered for this is the belief that it is preference that are important for MAU instruments, not description. However, valid preference measurement requires valid description of what is to be evaluated. If a descriptive element is unimportant, then the preference weight will be lower or zero. Use of the best preference methods and modeling cannot compensate for the absence of a nontrivial descriptive element. Content validity is discussed further in the section Construct and Content Validity.
Economics and econometrics: The gold standard for evaluating an MAU instrument is whether or not it measures ‘utility’ as envisaged in economic evaluation studies (see section Criterion Validity). This implies that a preference-based instrument should be used for scaling, and this is generally interpreted as implying the use of the SG or TTO. However, the subject is controversial, and some argue that there are insufficient reasons for excluding the RS. Recently, weights have been assigned using ranking techniques and item response theory, and the use of ‘best–worst scaling’ has been foreshadowed.
As noted above, the decision-theoretic requirement of item or dimension independence is difficult to achieve, and the resolution of this problem in the EQ-5D, SF-6D, and AQoL- 8D has been to use statistical methods to determine the importance of items. Multiattribute health states are evaluated with the SG or TTO and regressed on item scores or on dummy variables for the response levels. The regression assigns the most efficient weights to the items, i.e. the regression coefficients – which best explain variation in the health state values. The predicted values ‘fit the data’ as a regression line passes through the mean value of observations. Consequently, at least at the mean, the effect of ‘double counting’ is mitigated. The choice of regression model, however, is contentious. From MAU theory, linear (additive) models may be inappropriate, and utilities predicted from linear models may therefore incorporate systematic bias as they move away from the mean. However, these models are employed by the QWB, SF-6D, and EQ-5D.
Competing claims have been made about the use of decision analytic and econometric techniques, but the evidence is limited. Both approaches are based on a set of assumptions and constraints that are violated to a greater or lesser extent depending on the population group and disease. This suggests that validation requires context-specific evidence.
Evaluation Criteria
Evaluation criteria for assessing MAU instruments include practicality and reliability (measurement error should be a small fraction of total variability as judged, for example, by test–retest and by Cronbach’s a). The MAU instruments reviewed here have evidence of these properties, which is short in terms of most questionnaire-based research. The largest instrument – AQoL-8D – takes an average of 5.4 min to complete in its online version. Test–retest and Cronbach’s a coefficients are satisfactory according to accepted norms.
The most contentious criterion is validity, whether or not an instrument measures what it purports to measure. The lack of agreement between instruments noted earlier implies that some or all of the MAU instruments are not universally valid or that they seem to measure differing concepts, although this possibility has not been suggested in the literature.
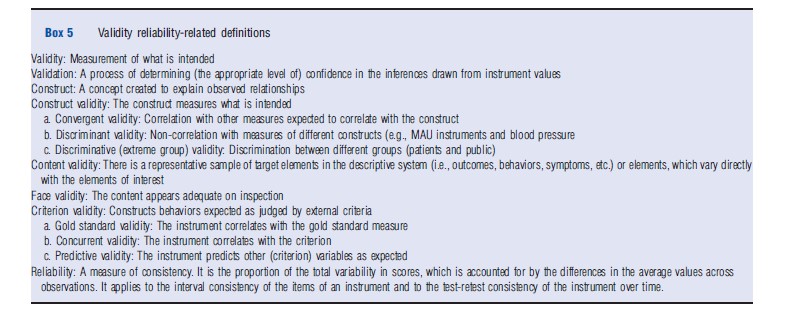
Different types of ‘validity’ are defined in Box 5. The common element is that each is a test that justifies greater or lesser confidence in the instrument’s predictions. This means that in practice an instrument is never (fully) ‘validated’ in the sense that it has been ‘proven universally correct’ and the statement that ‘an instrument has been validated’ is misleading in implying this. Rather, instruments are more or less supported both empirically and theoretically (an interplay sometimes described as a ‘nomological net’). Importantly, the strength of the evidence depends on the stringency as well as the outcome of the test.
Construct And Content Validity
The validity of an MAU instrument depends on the validity of its three components: the descriptive system (items and dimensions), the scaling method (TTO, SG, etc.), and the model used to combine items (additive, multiplicative, etc.). There is no consensus concerning the scaling method (TTO, SG, etc.). However, there is a relatively high level of agreement between scores from the chief scaling methods, and differences in between these could not explain the observed variation between instrument scores.
Combination models also differ and the evidence for the assumptions behind them is incomplete. Validity could be tested by comparing estimates of health state utilities from different models with independent holistic estimates of the same health states. Few such studies have been undertaken. Descriptive systems also differ very significantly in size, item content and syntax (Tables 1–3). The effect of this on MAU instrument scores and validity is an unresolved, although critical, issue. Some of the evidence is outlined in section Criterion Validity below.
The great majority of the validation studies in Table 6 are concerned with ‘construct validity’ and primarily ‘convergent validity’. These correlation-based studies are relatively weak tests, which are necessary but not sufficient for confidence that an instrument measures the utilities needed for economic evaluation. Correlation will occur as long as an instrument can, minimally, detect extreme values. It does not indicate that values have the properties needed for economic evaluation or even that both instruments use the same scale. In the linear relationship, U=a+bI, where I is an instrument’s estimate of true utility U, instrument validity would imply that a=0; b=1.0. For this reason, a better measure of association than correlation is the intraclass correlation (ICC), which tests the equivalence of absolute values. However, only a minority of the studies use this technique. The difference is potentially important. In the early five-instrument Australian study, the 15D had the highest average correlation with other instruments (construct validity). However, incremental changes in 15D were about half the magnitude of corresponding changes in other instruments indicating a low ICC. Similarly, the ability to discriminate between extreme groups is a weak test of the validity of the numerical values produced by an instrument.
Differences between instrument descriptive systems, summarized in Tables 1 and 2, indicate the potential for different levels of content validity. The early five-instrument Australian study anecdotally illustrated the importance of these differences when the same respondent scored 0.14 and 0.8 for the HUI 3 and EQ-5D, respectively. When the HUI 3 items for sense perception were altered from their reported scores to the highest HUI 3 item score (effectively removing them from the instrument), the predicted HUI 3 utility score rose to 0.74; that is, 91% of the original difference was attributable to items in HUI 3 which are not included in the EQ-5D. If the items in the EQ-5D had the same descriptive power – ‘content’ – in the context of sense perception, this would not have occurred.
Evidence for content validity is commonly obtained from the psychometric analyses, which led to the selection of the instrument’s item structure and, in particular, evidence of whether or not additional items were redundant or added new content. However, except for AQoL, generic MAU instruments have not been developed in this way.
Few other tests of content validity have been reported. The most common have been comparisons of ceiling and floor effects (i.e. ‘insensitivity’ close to ‘best’ and ‘worst’ health). The test is limited as it applies only to extremities of the scale and results will vary with either the item structure or the weights attached to a given set of items. As noted in the section History, Description and Construction of MAU Instruments, ceiling effects vary significantly between instruments.
In one recent test, scores for each attribute of the EQ-5D, HUI 2, and SF-36 were individually predicted from the scores obtained by the other two instruments using data from 264 German patients. Adjusted R2 values were between 0.01 and 0.57. The SF-6D attribute ‘role limitation’ and HUI 2 ‘sensation’ were ‘virtually unrelated to the other instruments.’ The authors concluded that the instrument content differs ‘so much that… (they) would produce different valuations even if other components of the instruments were the same’ (Konerding et al., 2009).
Rather than demonstrate differences, the authors of the Australian study reported in Figure 3 (Khan and Richardson, 2011) attempted to identify missing content. Instruments on the vertical axis in Figure 3, which are relatively sensitive to a particular dimension, will, on average, have lower scores than predicted. Points will be below the line. The ratio of dimension scores of individuals from above to below the line therefore indicates the relative sensitivity of the instrument to a dimension. Results suggest that, at least in the relatively healthy population surveyed, HUI 3 has less content than other MAU instruments in the domains of mental health and relationships, and that AQoL-8D has greater content for all of the mental and social dimensions. EQ-5D is relatively sensitive to pain. Unexpectedly, HUI 3 was not significantly more sensitive with respect to senses, but this is probably because the sample was small (n ¼ 158) and there were few respondents with impaired senses.
Criterion Validity
Comparisons of an instrument with external criteria are usually classified as tests of concurrent or predictive validity. They raise the question of what represents an acceptable external criterion. The theoretical questions include the choice between (inter alia) ‘decision’ and ‘experience’ utilities (i.e. evaluation before and after experiencing a state); the selection of the appropriate judge of utility – the public or patients – and the measurement perspective – individual or social. These issues are unresolved in the literature. However, instruments (of necessity) incorporate judgments with respect to each of these questions.
All of the instruments in the present review incorporated an individual perspective. TTO or SG values were obtained from people imagining they were, personally, in a health state. They were not asked to be representatives of the society. Most instruments embody answers from members of the public, not from patients (AQoL-7D and AQoL-8D obtained answers from both). Perhaps the most important neglected question is the scope of the construct ‘health-related quality of life’ to be incorporated in the instrument: should it include social dimensions, be restricted to a ‘within the skin’ concept or be defined by what individuals have in mind when asked about ‘health?’
Subject to these caveats, a limited number of tests of criterion validity have been reported. One approach has been to ask respondents to directly value their own health state using a scaling instrument (TTO, SG, etc.) and to compare the result with the value predicted from an MAU instrument. Testing individual instruments this way has provided supporting evidence for the validity of the HUI and 15D.
The early Australian study (Hawthorne et al., 2001) tested the validity of 15D, SF-5D, AQoL-4D, HUI 3, and EQ-5D using the ‘self TTO’ – i.e. the reduction people would accept in their own life expectancy in exchange for perfect quality of life. The aim of the test was two-fold: to determine (1) which instrument explained most variation in self TTO and (2) which instrument best explained what other instruments failed to explain, i.e. the residual from the first stage analysis. The results of both tests were similar: 15D demonstrated the greatest explanatory power followed, respectively, by SF-6D, AQoL-4D, HUI 3, and EQ-5D.
The results of this study are similar to those of a recent five instrument Finnish study (Honkalampi and Sintonen, 2010). However, the properties of self-referential measures have not been discussed in the economics literature and interpreting these results is difficult. A further suggested test is the use of willingness to pay as a criterion for evaluating MAU instruments. However, the technique is controversial in the context of QALYs, and no one has adopted the suggestion empirically.
A weak test of preference is to determine whether most people agree that improvement has occurred when MAU instrument scores increase. Applying this test, Roberts and Dolan (2004) found that a 0.20 increase in the EQ-5D score was necessary before 70% of respondents agreed that any improvement had occurred.
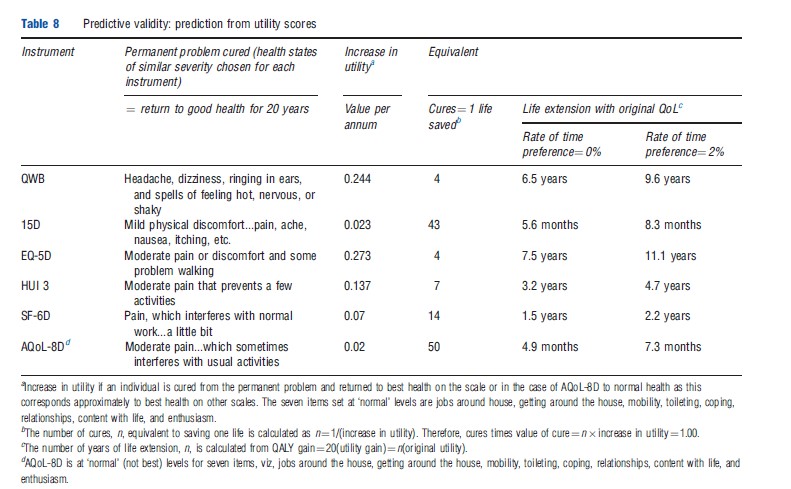
The logic of this test of predictive validity was to use MAU instrument scores to predict what people would choose. Similar logic was used earlier in a study by Nord et al. (1993) drawing on the idea that QALYs are the product of utility, life years, and the number of people affected. From this, MAU instrument scores were used to predict the number of people moving from a health state to full health, which would be equivalent to saving one life. Results from the QWB and HUI 1 were so implausible that they suggested a lack of predictive validity.
An objection to this latter approach is that the test alters the distribution of utility and introduces a consideration of equity, which may (or may not) invalidate the conclusion. However, the method could have been applied with respect to individuals’ personal trade-offs between quality of life and length of life, the right hand columns of Table 8. According to this, the life extension that is equivalent to a moderate improvement in the quality of life (described in somewhat different ways across instruments) is 38 times greater for the EQ- 5D (11.1 years) than for AQoL-8D (3.5 months) and 14 times greater for the QWB (9.6 years) than for the 15D (8.3 months). As with the Roberts and Dolan (2004) study, (dis)agreement with the predictions from each instrument could be obtained independently from the population. Because the test is simple, it is a potentially powerful and rigorous test of criterion validity in the context of economic evaluation.
Conclusions
Numerous questions have not been considered here. Foremost is disagreement about what is to be measured. ‘Health’ like ‘beauty’ is a vague concept and has been operationalized very differently. In effect, each MAU instrument has provided its own unique definition, which has generally been unchallenged. The chief decision concerns the breadth and content of the definition. If an MAU instrument is intended strictly for use within a Government Health Service, the definition may remain narrow and exclude items extraneous to government funding, for example, social or dental-specific dimensions. The values embodied in the WHO definition of health and in orthodox economics would suggest a broader, more encompassing approach. That is, anything affecting preference should be included.
Other omitted issues include perspective and the concept of utility. Present MAU instruments seek to measure personal, not social, preference. These are generally measured on the basis of descriptions given to the public or to individuals who have experienced the health state and without any consideration given to the distribution of benefits. Challenges include a proper demonstration that MAU instruments have construct validity in different disease areas and, more fundamentally, predictive validity using criteria relevant for economic evaluation.
The article has focused on the construction and validity of MAU instruments. It indicates that the scores obtained from different MAU instruments differ significantly and, consequently, QALY values, CUA ratios, and the likelihood of health service funding are all significantly affected by the choice of instrument. The numerical values obtained from the instruments depend on the validity of the descriptive system, model combining the items, and scaling instrument. Of these, the evidence suggests greatest agreement about the scaling instruments. TTO, SG, and even RS values correspond fairly well. Despite this, the focus in the economics literature has been on this choice, with overall instrument validity often judged primarily on the basis of the scaling instrument.
There has been little empirical evidence published with respect to the choice of the MAU model. Authors of the HUI 3 and AQoL-8D both found evidence that additive models were less satisfactory than multiplicative models. However, these models permit double counting of the disutility. Econometric linear models are flexible and ensure that predicted values ‘pass through’ the observed utilities, at least at the mean. But extrapolation with an additive model is problematical. Apart from AQoL-8D, there has been little experimentation with nonlinear models. Least agreement exists between the items of the MAU instrument’s descriptive system, but this is where there has been least discussion. Instruments have been created using different approaches and generally with little explicit regard for content validity. It is therefore, at this level that differences between instrument scores will most probably be found.
None of the studies evaluating MAU instruments (which have been published) appears to have concluded that a scale is invalid. This poses a problem for decision makers as the outcome of an evaluation may presently depend on the choice of instrument. The approach to this problem by the UK NICE has been to nominate a preferred instrument for use in all evaluations. This does not overcome the underlying problem because, as recognized by NICE, a single instrument may not be an appropriate measure of health-related utility in all circumstances and, at present, there are no evidence-based guidelines concerning which instrument to use or how to interpret results from instruments which conflict.
Instruments are neither right nor wrong. The evidence suggests that they are more or less sensitive in different contexts. Use of a single instrument will favor interventions affecting health states where the instrument is sensitive (and the intervention efficacious) and disadvantage interventions where sensitivity is low. Researchers presently have little choice but to select from available instruments and to evaluate their ability to measure the health states which are of relevance to them. In the longer term, there is a need for a significant research program to determine which instruments should be used in which contexts and how to compare their values.
References:
- Fryback, D. G., Palta, M., Cherepanov, D., Bolt, D. and Kim, J. (2010). Comparison of 5 health related quality of life indexes using item response theory analysis. Medical Decision Making 30(1), 5–15.
- Hawthorne, G., Richardson, J. and Day, N. A. (2001). A comparison of the assessment of quality of life (AQoL) with four other generic utility instruments. Annals of Medicine 33(5), 358–370.
- Honkalampi, T. and Sintonen, H. (2010). Do the 15D scores and time trade-off (TTO) values of hospital patients’ own health agree? International Journal of Technology Assessment in Health Care 26(1), 117–123.
- Khan, M. A. and Richardson, J. (2011). A comparison of 7 instruments in a small, general population. Research Paper 60. Melbourne: Centre for Health Economics, Monash University.
- Konerding, U., Moock, J. and Kohlmann, T. (2009). The classification systems of the EQ-5D, the HUI II and the SF-6D: what do they have in common? Quality of Life Research 18, 1249–1261.
- Nord, E., Richardson, J. and Macarounas-Kirchmann, K. (1993). Social evaluation of health care versus personal evaluation of health states. International Journal of Technology Assessment in Health Care 9(4), 463–478.
- Roberts, J. and Dolan, P. (2004). To what extent do people prefer health states with higher values? A note on evidence from the EQ-5D valuation set. Health Economics 13, 733–737.
- Brazier, J., Ratcliffe, J., Tsuchiya, A. and Salomon, J. (2007). Measuring and valuing health benefits for economic evaluation. Oxford: Oxford University Press.
- Nord, E. (2001). Health state values from multi attribute utility instruments need correction. Annals of Medicine 33, 371–374.
- Richardson, J., McKie, J. and Bariola, E. (2011). Review and critique of health related multi attribute utility instruments. Research Paper (64). Melbourne: Centre for Health Economics, Monash University. ISBN 1 921187 63 8.
- Streiner, D. L. and Norman, G. R. (2003). Health measurement scales: A practical guide to their development and use. Oxford: Oxford University Press.