In their seminal 1965 study, Kitagawa and Hauser documented that mortality in the US fell with education. Since then a very large number of studies have confirmed that the well-educated enjoy longer lives: for example, in 1980, individuals with some college education at the age of 25 years could expect to live another 54.4 years, whereas life expectancy at the age of 25 years for those without any college education was only 51.6 years.
Not only are the differences in health by education large, but also, by most measures, these differences have been growing in recent years. For instance, in 2000, those with some college education lived 7 years longer than those without any college education – thus the gap increased by 4 years since 1980. Education not only predicts mortality in the US but also is an important predictor of health in most countries, regardless of their level of development. Furthermore, the life expectancy gaps are growing around the world. Education gradients in mortality since 1980 are also known to have increased in Estonia, Sweden, Finland and Norway, Russia, Denmark, England/Wales, and Italy – although caution must be exercised as the number and composition of individuals within education categories has also changed substantially over time. The more educated are also noticeably healthier while they are alive, as they report being in better health, having fewer health conditions and limitations. Children of educated parents are also in better health in both developed and developing countries.
This article synthesizes what is known about the relationship between education and health in both developed and developing countries. Although previous work has thought of the effect of education separately for richer and poorer countries, there are insights to be gained by integrating the two. For example, education is associated with lower mortality in most developed countries, and this relationship is similar regardless of the generosity of the social protections and health insurance systems that are in place. This suggests that access to care is not the main reason for the association in the first place. This approach is illustrated by comparing the effects of education on various health and health behaviors around the world to generate hypotheses about why education is so often (but not always) predictive of health.
The article then goes on to examine theories for the relation between education and health and then review the empirical evidence on this relationship paying particular attention to causal evidence and evidence on mechanisms linking education to higher health.
Stylized Facts About Education And Health
To examine the link between education and health across countries, data from three sources are combined. Data for most developing countries come from the Demographic and Health Surveys (DHS) for years between 2004 and 2009. Data for the US come from the Behavioral Risk Factor Surveillance System (BRFFS) for 2005. Data for Europe come from the Eurobarometer Surveys (2005 and 2009). Data for a total of 61 countries are known. Each country was matched to its per capita level of gross domestic product (GDP) in the current US dollars reported by the World Bank. To create a consistent sample, the attention is restricted to women aged 15–49 years (the DHS does not collect data on men or older women). More details on the data construction are in the Data Appendix.
Education is measured as years of school in the DHS and the BRFFS, but the Eurobarometer only asks about the age at which a person finished schooling. It is assumed that years of schooling in the Eurobarometer data are 5 years less than the age at which schooling was finished. As some people take significant time off before finishing schooling, the authors truncate schooling at 25 years. Although not ideal, this is the only standardized data source with a large number of countries.
For all of these countries, the measures of height (in centimeters) and weight (in kilograms) are known, which are used to construct body mass index (BMI = weight/height squared), an indicator for being underweight (BMI≤18.5) and an indicator for being obese (BMI≥30). The data from the DHS come from actual measures, whereas the data for the US and Europe are self-reported. For all of the countries, it is also known whether the person is currently a smoker. For a few developing countries and all developed countries, it is known whether the person drinks alcohol. Finally, only for developing countries, measures of hemoglobin levels (HbA1c) are known, which is a key indicator of diabetes and a measure of whether the person had a sexually transmitted disease in the past year.
To document basic patterns in the relationship between education and health, the following ordinary least squares (OLS) regression for each country in the sample is estimated:
![]()
where Hi is a health or health behavior indicator of individual i in country c, Education is measured in years, and Xi contains basic demographics: age, age squared, marital status, ethnicity, race, and religion dummies. For each country and outcome, the regression coefficient βlc is obtained, which is plotted by the level of GDP (in logs). All of the surveys have complex sampling design schemes, and the weights provided by the survey are used to compute means and weight regressions.
It is difficult to interpret the coefficient of education in these regressions as causal because education and health could be both determined by unobservable factors. Also the coefficient on education might reflect the effect of health on schooling rather than the reverse. These issues are discussed in the Section Evidence on the Causal Effect of Education. For the time being, the correlations that are observed are described and the reasons for the patterns across countries are hypothesized.
The effect of education is estimated for each country in a linear model that includes years of education. It is not clear whether years of schooling are comparable across countries because the quality of education differs widely by country and thus the actual education of individuals might differ even when years of school are comparable. Ideally, one would use test scores or other measures of achievement (such as literacy and numeracy), but these are not available here or in most surveys. Also, one might prefer to look at nonlinear models, where the effect of education is allowed to vary depending on the level of education. Previous research has generally found that linear models are good approximations, although this refers to high-income countries. Nevertheless, the estimates are of interest because they mirror the standard estimates that are produced when looking at specific countries and times. The results presented here are restricted to women because the DHS surveys collect information systematically on them but not necessarily for men. Previous research documents that correlations between education and health are similar for men and women, although in general, correlations are stronger for men, but this varies depending on the outcome.
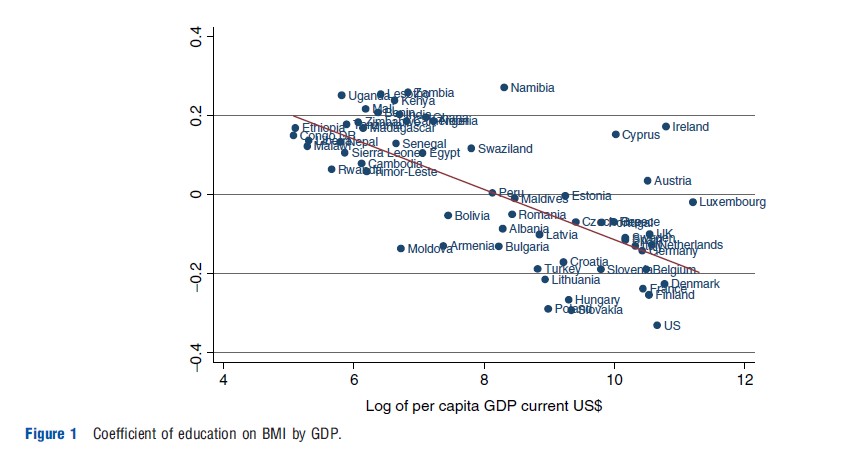
Figure 1 shows the education gradient in BMI as it relates to average income – each dot in the graph corresponds to the coefficient of education on BMI obtained from a separate regression for each country. BMI is generally taken as an indicator of short-term nutrition. The figure suggests a clear pattern by income: in poorer countries, those with more education have higher BMIs, whereas the opposite is true in richer countries. The crossover point is income of approximately US$3000 per capita, roughly the income of Bolivia and Peru. However, the relationship between health and BMI is not monotonic: higher weight (given height) is associated with lower mortality at low levels of weight, but after some threshold, increased weight is associated with larger mortality. To disentangle these effects, the next set of estimates reports the effect of education on the likelihood of being underweight and on the likelihood of being obese: both of these are indicators of poor health.
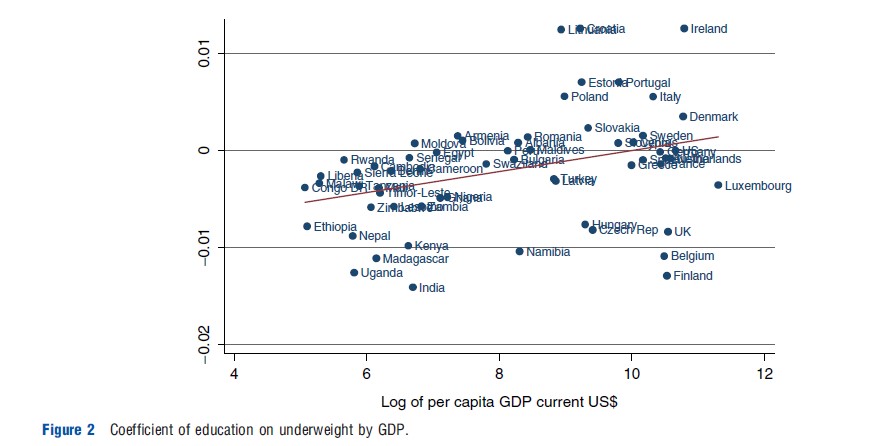
Figure 2 shows the patterns for being underweight. Overall, education is associated with a decrease in undernutrition: most coefficients are either negative and statistically significant or essentially zero (although there are a few exceptions). The effect of education is largest for the poorest countries and then becomes zero (or positive) as GDP rises. This is essentially due to the fact that there is very little undernutrition in countries that have reached middle levels of income, and there is no effect of education on malnutrition when the prevalence rates are low. This is more evident in Figure 3, which plots education coefficients against levels of malnutrition (the share of the population that is underweight).
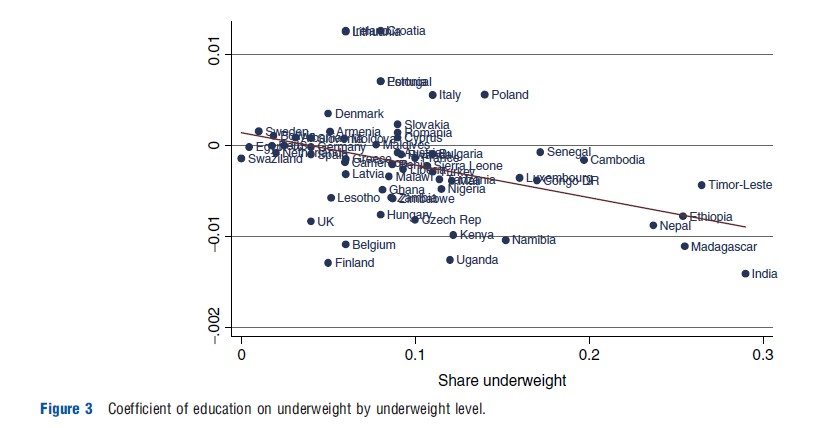
Figure 4 shows the patterns for obesity. These patterns are very similar to the patterns for BMI: In poorer countries, the effect of education on obesity is positive and significant, whereas it becomes negative and significant for richer countries. This pattern has been noted before and it is more marked for women than men (The graphs presented here only show patterns for women).
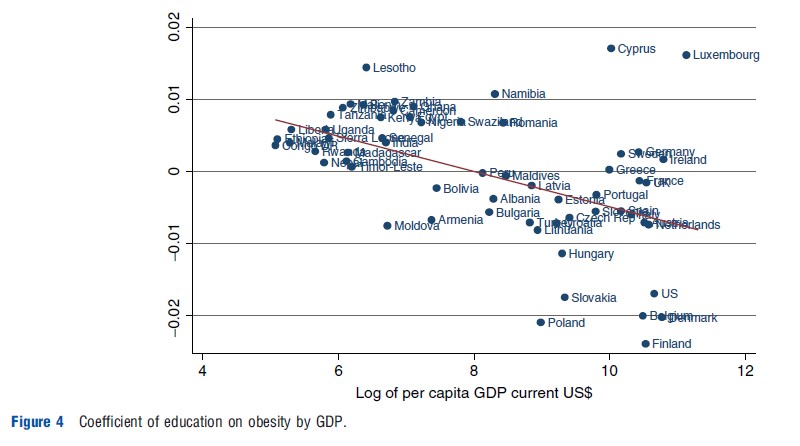
Thus, it is observed that around the world the more educated avoid malnutrition, but not always obesity. It is possible that when levels of nutrition are low, obesity is associated with increased survival because people are better able to fight infectious disease, and chronic problems are not large killers. But once infectious diseases fall and chronic conditions become more important, the pattern reverses (conditional on knowledge that obesity is bad). It is also possible that girth is a status symbol or symbol of wealth in societies that are poor; but the same in rich societies where knowledge of the health consequences is widespread, the opposite becomes true, as rich individuals will devote their resources to staying thin and fit. But the data strongly suggest that the effect of education depends on the level of development and the position of the countries in the ‘nutrition transition’ in particular: as countries develop, the types of food available (high-fat, high-sugar, and high-density processed foods in particular) and their costs change substantially.
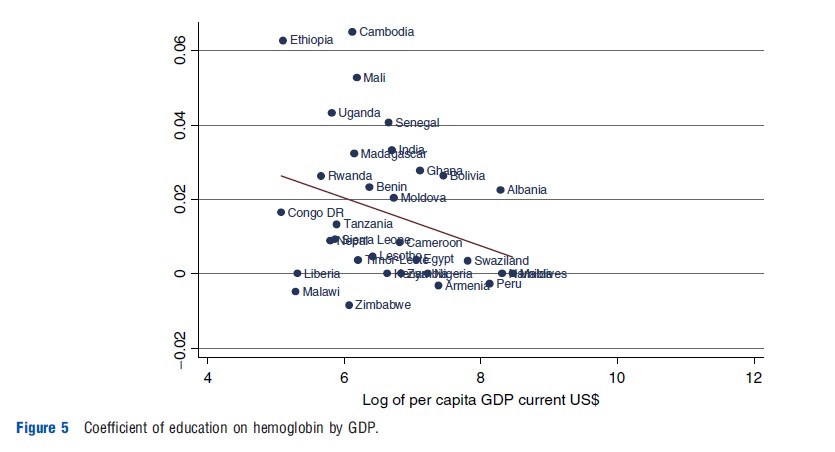
Figure 5 shows the patterns for hemoglobin levels by income – although only for women in developing countries. Again, it is found that the effect of education is protective at low levels of income, and then decreases with GDP; this is again a function of the fact that on average hemoglobin levels rise with GDP. So in poorer countries, the more educated avoid malnutrition. But Figure 6 shows that they do not always avoid disease; among very low-income countries, there are more countries where education is associated with a higher incidence of sexually transmitted infections (STIs) than countries where education is protective. But there is a trend by income again: education is more likely to be protective for higher levels of GDP. Recent work that looks at sexual behavior responses by education level in Africa also reports that the ‘effect of education’ varies depending on the stages of the human immunodeficiency virus (HIV) epidemic.
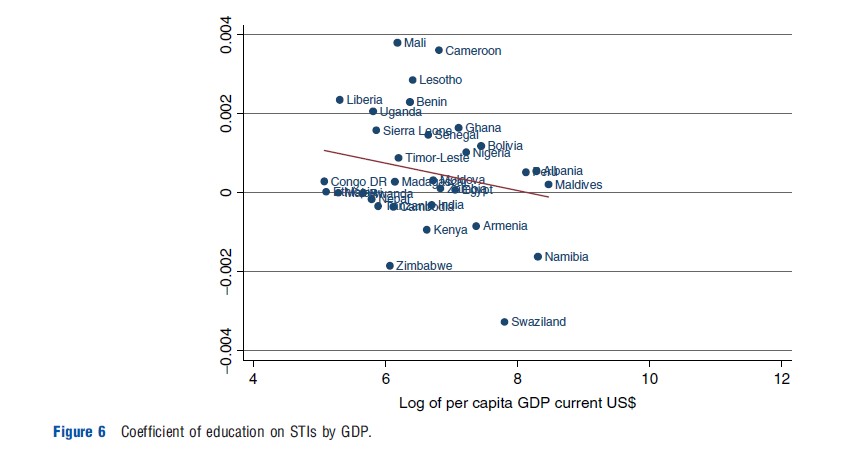
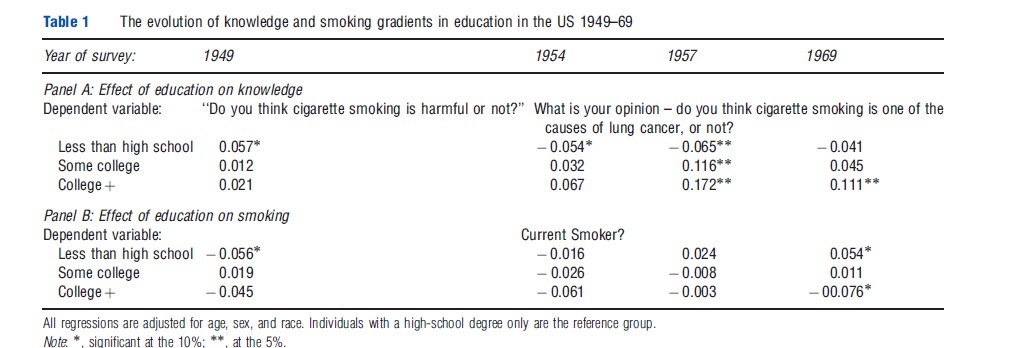
Figure 7 shows the patterns for the effect of education on smoking, the leading cause of preventable deaths worldwide. In general, the effect of education on smoking is negative, but for the poorest countries the coefficients tend to be very small. Also, for many middle-income countries, there is a positive effect of education. It is unlikely that this reflects differential knowledge of the harms of smoking among the better educated. The danger of cigarette smoking is well known around the world even in the poorest countries: for example, in Bangladesh, 93% of smokers report that smoking causes lung cancer (International Tobacco Control Policy Evaluation Project). Rather, it may reflect the social acceptability of smoking as income increases or the onset of public policies to reduce smoking at very high incomes. It is also possible that in some countries the effects of knowledge are counteracted by the effects of higher incomes, because smoking is a normal good. Again these patterns suggest that the effect of education on smoking depends on the level of development defined both in terms of income and knowledge and will, therefore, vary over time and space. Table 1 presents some evidence of this ‘smoking transition’ for the US. In 1949, high school dropouts were less likely to smoke than high school graduates or individuals with higher education – the opposite of what is observed today. In 1949, dropouts were also more likely to think smoking was harmful. But between 1950 and 1970, the more educated became more likely to think that smoking was harmful as knowledge of the harms of smoking emerged; and by 1969 they were also less likely to smoke.
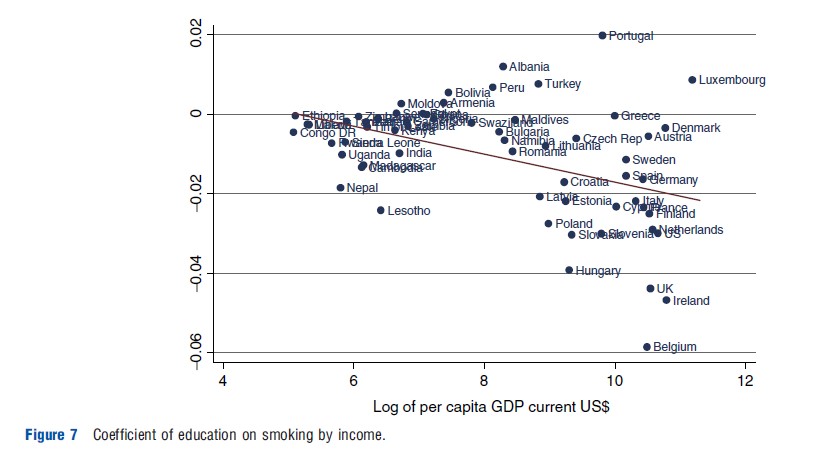
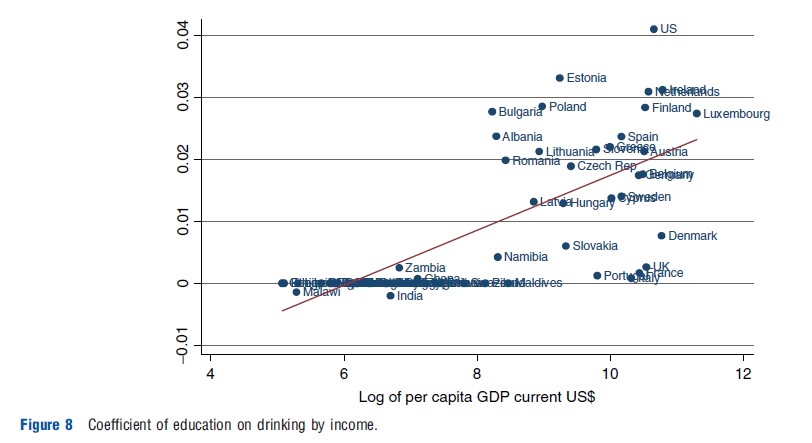
Figure 8 shows the patterns for drinking. Data on drinking for many developing countries are not known, so somewhat higher income countries are examined. Alcohol appears to be a normal good. Education increases the odds of drinking alcohol in almost all the countries that are examined. Modest alcohol consumption might not be detrimental to health, so it is not necessarily clear that these coefficients have the ‘wrong’ sign. Ideally, it would be better to determine whether education lowers heavy drinking, which does fall with education levels in the US and the UK, but the data are not consistently available across countries.
The previous figures suggest important patterns by education and could be taken as reflecting causal relationships from education to health. However, it can also be documented that education is partly determined by health by looking at height. Height is generally thought of as an excellent indicator of early childhood environment, as much of the variation in adult heights is determined by the age of 3 years. Thus, the coefficients of education on height from eqn [1] most likely reflect the effect of health on the quantity and quality of education individuals obtain, rather than the effect of education on final height. Before looking at this, two caveats are in order. First, there is a critical growth period in adolescence where the remaining differences in final adult height are determined. Thus, it is possible that some of the relationship between height and education is due to an effect of schooling on height. Second, height itself may be a function of parental education, which may independently affect child education. Nevertheless, most researchers treat the relationship between height and education as mostly reflecting the impact of exogenous health on education.
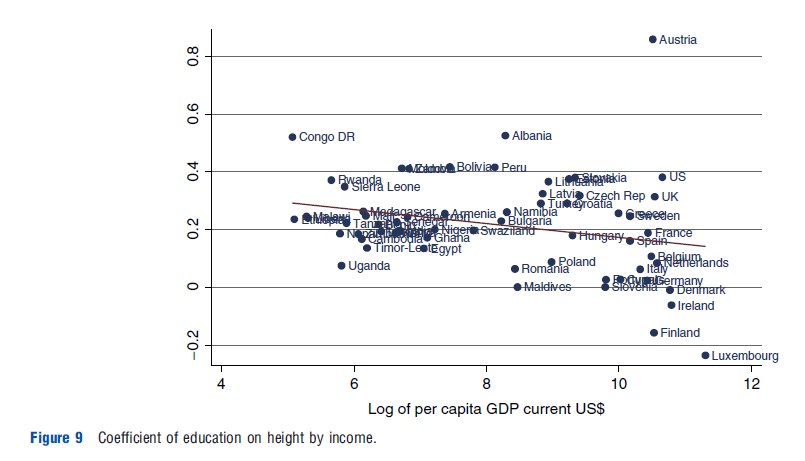
Figure 9 shows the results for height. For almost all the countries examined, more educated women are taller and the relationship is generally statistically significant. And although the effect falls a bit with GDP, education is still very strongly associated with height, even in very rich countries (with a couple of interesting exceptions among the richest countries).
Summary
All said, the international data on health and education show several stylized facts. The clearest relationship is between income and the education gradient in nutritional intake. Poorer countries are characterized by a mix of undernutrition and overnutrition. Many people are undernourished or anemic in poorer countries, and these outcomes are strongly negatively related to education. Less educated individuals are more likely to be underweight and anemic; better educated people are more likely to be overweight or obese. In richer countries, where undernutrition is not very prevalent, there is no education gradient in undernutrition. In contrast, in these countries the prevalence of obesity is large and there is a large positive education gradient in obesity. This suggests that education is protective for the outcomes that are known to be bad for health.
The link between education and height is also clear. In all countries – even the richest – better educated people are taller than less educated people. The magnitude of the relationship is large throughout the world.
The link between education and other measures of health is much less clear. The correlation between education and smoking is nonlinear in income; the relationship between education and height or STIs is unrelated to income. These patterns demand a different explanation than a simple rich–poor dichotomy. They also suggest that the effect of education on health varies depending on the level of development, and holding GDP constant, on the specific health problems the country faces.