Demography is the study of the growth, change, and structure of the human population. Changes in a population’s size and structure are caused by changes in the birthrate, the death rate, and the net migration rates. Demographic research focuses on why people have the number of children they do; on factors that affect death rates; and on the reasons for immigration, emigration, and geographic mobility. Understanding a society’s demography is an essential tool in determining current and future public health needs.
History of the Human Population
The twentieth century was a very unusual period, demographically. World population grew at a more rapid and sustained pace than at any time in human history, as shown in Figure 1. The global population grew from approximately 1.7 billion people in 1900 to 6 billion in 1999. The annual population growth rate averaged 1.3 percent for the entire twentieth century, and was as high as 2.3 percent between 1965 and 1970. (A sustained 2.3 percent annual growth rate would have meant a doubling of the world’s population in thirty years.)
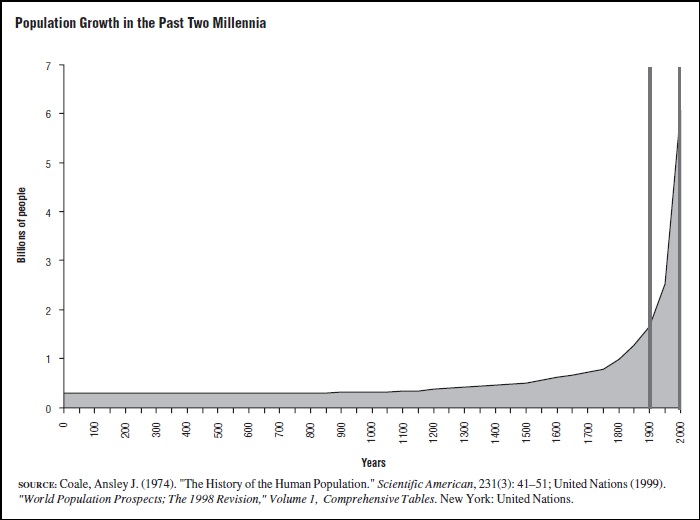
Figure 1. Population Growth in the Past Two Millenia
By contrast, throughout most of history the human population grew very slowly. Occasionally, in some regions, there were periods of very rapid population growth—and also very rapid population decline. However, these periods generally averaged out over time, and overall population growth was extremely slow. For example, between the years 1 C.E. and 1750, the average annual population growth rate was only 0.06 percent. (At this rate, the population would double, on average, only once every 1,250 years.) A period of rapid population growth began around 1750 in Europe and North America. Rapid population growth in most other parts of the world began between 1920 and 1960.
Why did the population begin to grow rapidly first in Europe and North America, next in Japan, Australia, and New Zealand, then in most of Asia and Latin America, and finally in Africa and the rest of the world? The answer lies in how a population grows or declines. A change in the size of a population occurs in only a few ways: Either births and immigrants add new members to the population, or deaths and emigrants remove members from the population. Throughout most of human history both birth tates and death rates were high, though birthrates were slightly higher than death rates on average. Slightly higher birthrates than death rates meant that the population was growing, although at a very slow rate. Migration added to some populations and subtracted from others at different periods in history.
Beginning in the eighteenth century, however, death rates began to decline, slowly at first and then more rapidly. For example, death rates declined from about 35 to 45 deaths per 1,000 population in the period from 1750 to 1850 to around 8 to 12 deaths per 1,000 in low-mortality countries (Europe, North America, Japan, and Australasia) in the late twentieth century. This decline began in different parts of the world at different times. In North America and Europe, the timing of the mortality decline was closely tied to the beginning of the Industrial Revolution. In Asia, Latin America, and Africa, declines in death rates took place mostly during the twentieth century. Declining death rates in combination with continuing high birthrates triggered the rapid growth of the population. Simply put, many more people were born into the population each year than left it through death.
Historical research shows that much of the mortality decline in Europe and North America occurred before most modern changes in medical technology and treatment, and therefore was caused by other factors. These factors include improvements in public health (including sanitation, waste disposal, clean water supply, and quarantine); changes in personal hygiene (including bathing, handwashing, and household cleanliness); improved standards of living (including better nutrition and housing); and improved political, economic, and transportation systems, which led to better responses to food shortages and drought.
These factors also played an important role in reducing death rates in Asia, Latin America, and Africa during the twentieth century. However, improvements in medical and public health technology were also important in these regions. For example, immunization programs, pesticide spraying against mosquitoes that spread malaria and yellow fever; oral rehydration therapy for diarrhea; antibiotics; and improved and more widely available health care have all contributed to mortality reduction.
Despite continuing gains in health and survival, the pace of population growth began to slow in industrialized countries in the mid–twentieth century and in other regions of the world in the last three decades of the twentieth century. The reason is that birthrates began to decline. In some European countries, birthrates fell so low by the end of the twentieth century that their population growth rates became slightly negative, meaning that the number of people in these countries is declining slightly. For example, between 1995 and 2000, Italy had a birthrate of 9 per 1,000 population, or an average of about 1.2 births per woman. During this period, Italy’s death rate was 10.4 per 1,000 population, so the Italian population became slightly smaller each year. Birthrates have also fallen to historically low levels in many countries in Asia and Latin America. There is also substantial evidence that birthrates are declining in many African countries as well. However, there is still great variability in birth and death rates among regions of the world, as the figures in Table 1 show.
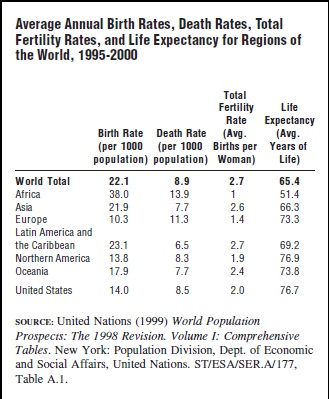
Table 1
The decline in birthrates is due to dramatic changes in economic and social conditions, ideas about the family and the role of children and women, the availability of family planning programs, and the acceptance and use of contraception. Although much of the fertility decline in Europe and North America occurred before many modern contraceptive methods were available, the development and widespread use of contraceptive methods has played a major role in reducing fertility throughout the world. Contraceptive methods include the hormonal pill, the intrauterine device (IUD), sterilization (vasectomy for men and tubal ligation for women), hormonal injections and implants, and barrier methods such as condoms, spermicidal foam and jelly, diaphragms, and cervical caps. In some countries, such as the former Soviet Union and Japan, induced abortion has also played an important role in reducing the birthrate.
Even though birthrates have fallen substantially in many countries, their populations continue to grow because of the effects of their age structure, or “population momentum.” For example, the U.S. population continued to grow at almost 1 percent per year during the 1980s and 1990s despite a very low birthrate. The reason is that a substantial proportion of the population was in their childbearing years because of the “baby boom” in the 1950s and early 1960s. The effects of population momentum is temporary: In the absence of immigration, if birthrates remain low for the next fifty years, the size of the U.S. population will begin to decline. However, immigration is likely to continue during this period, keeping the U.S. population growing at a relatively slow pace.
Measuring Population Change
Demographers use several standard ways to measure population processes. Birthrates and death rates are the two most important measures. A birthrate (also called a crude birth rate) is the number of births in a given place and year per 1,000 population:
![]()
Similarly, the death rate (also called a crude death rate) is the number of deaths in a given place and year per 1,000 population:
![]()
The birthrate and death rate for the United States between 1995 and 2000 were 14 births per 1,000 population and 8.5 deaths per 1,000 population.
In a population with no immigration or emigration, the population growth rate is simply the birthrate minus the death rate divided by 10. By convention, population growth rates are expressed in percent (that is, per hundred people) rather than per thousand people. In the United States, the annual population growth rate (which was 0.83 percent for the years 1995 to 2000) is higher than the difference between the birthrates and death rates, because of immigration. In fact, immigration accounted for approximately one-third of the annual growth rate in the United States between 1995 and 2000.
Two other indices are commonly used to measure population change. The Total Fertility Rate (TFR) measures the average number of children that women would have in their lifetime if birthrates remain at current rates in the future. Between 1995 and 2000 the TFR ranged from 1.2 children per woman in Italy to 7.1 children per woman in Uganda. Life expectancy measures the average number of years that people would live if death rates remain at the current in the future. Table 1 shows that the TFR and life expectancy varied substantially among different regions in the world between 1995 and 2000.
Demographic Trends in the United States
At the start of the twenty-first century, the population of the United States indicates historically low birthrates and death rates and relatively slow population growth. The U.S. average annual population growth rate was 0.83 percent between 1995 and 2000. About two-thirds of this growth rate is accounted for by more births than deaths in the United States each year. About one-third is due to the presence of more immigrants than emigrants each year.
A major influence on the U.S. population in 2000 is the “baby boom” that took place between approximately 1948 and 1965. Birthrates rose substantially in the United States during this period because many couples postponed having children during the Great Depression in the 1930s and during World War II. These couples began to have children at the same time as younger couples who were just getting married. Another reason for the baby boom was the good economic climate conditions during the 1950s, which meant that couples could afford to have more children. Demographers use the term “cohort” to mean all people who were born during a particular year. The cohorts born during the baby boom were much larger than the cohorts born in previous years. Because of the larger cohorts during the baby boom, hospital maternity wards were overcrowded and demand for obstetric and pediatric health services rose substantially. As the baby boom cohorts got older, elementary schools, then high schools, and then colleges bulged at the seams as they tried to cope with a sudden increase in the number of students.
As the baby boom cohorts began to enter their childbearing years (conventionally defined as 15 to 49 years of age for women), they had much lower fertility rates than their parents. For example, the Total Fertility Rate for women during the baby boom years 1955 and 1960 averaged 3.7 children per woman. Women born during the baby boom who were having their children between 1985 and 1990 averaged only 1.9 children per woman. However, because the baby boomers were a large proportion of the U.S. population, the number of births actually rose between 1985 and 1995 compared with earlier years. This is the process of population momentum, described above. The United States has an unusual age structure as a result of the baby boom. Because of this age structure, the U.S. population will continue to grow for several more decades even if fertility rates remain low.
The baby boom will continue to have another major impact on the demography of the United States in the next several decades—baby boomers will contribute to the aging of the population. People born at the beginning of the baby boom are just beginning to approach retirement age in 2000. Between 2010 and 2030, most people in the baby boom cohorts will reach age 65. America’s population will continue to grow older, on average, because of the aging of the baby boom cohorts. Another reason that Americans will be older on average is that fertility and death rates are low. That means that a smaller proportion of the population are young children, and therefore, that a larger proportion of the population are older adults. It also means that people are living longer lives, on average, than in the past.
The aging of the U.S. population has been gradual during the last quarter of the twentieth century. In 1975, 10.5 percent of the population was age 65 and older. By 2000, this figure had grown only to 12.5 percent, a relatively modest increase. However, by 2025, almost 19 percent will be age 65 and older, and by 2050 the figure will be almost one-quarter of the population. Undoubtedly, the aging of the population means that the health needs and problems of older Americans will become an increasingly important focus for public health policy in the early twenty-first century.
Another major demographic trend in the United States is immigration. The United States is a country of immigration. Almost all Americans are descended from immigrants to North America. Even Native Americans, who preceded European and African settlers by many centuries, are believed to have immigrated to North America from Asia. The volume of immigration to the United States has been increasing since the 1950s. Between 1992 and 1999, an average of 800,000 immigrants were legally admitted to the United States every year. This number includes family members of U.S. citizens and residents, as well as refugees, highly skilled workers, and farm workers and lower-skilled workers. An additional 250,000 immigrants probably entered the United States illegally during the same period. Approximately 220,000 people were estimated to emigrate (that is, to move to other countries) each year in the late 1990s.
Between the beginning of European settlement in the 1600s and the Civil War, most immigrants came from northern and western Europe or (generally as slaves) from Africa. Between 1880 and 1914, there was a major wave of immigration to the United States. In 1914, approximately 1.2 million immigrants were admitted, a number which far exceeds the average annual number of legal immigrants in the late 1990s. Although most immigrants arriving during this period continued to come from northern and western Europe, a substantial proportion came from southern and eastern Europe and from Asia.
Among immigrants arriving legally in the 1990s, approximately half came from Latin America, 30 percent from Asia, and 13 percent from Europe. Just as earlier waves of immigration molded the ethnic composition of the United States, recent immigration patterns have contributed to the current ethnic makeup as well. However, other factors have also had an important effect on ethnic composition at the end of the twentieth century, including intermarriage among couples of different ethnic backgrounds and small but significant differences in fertility rates between ethnic groups. In 2000, approximately 72 percent of Americans were white non-Hispanics, 12 percent were African American, 11 percent were Hispanic, 4 percent were Asian, and 1 percent were Native American. The U.S. Census Bureau estimates that by 2025 about 62 percent of the population will be non-Hispanics whites, 13 percent African America, 18 percent Hispanic, 6 percent Asian, and 1 percent Native American. Many Americans have multiple ethnic backgrounds, however, and cannot be classified easily into a single ethnic category. For this reason, the United States 2000 Census allowed people to classify themselves in more than one ethnic group. Estimates of the future ethnic composition of the United States have to realize that classification by a single ethnic origin is likely to be less useful in the future.
Demography and Public Health Needs
Understanding a society’s demography is an essential tool in determining current and future public health needs. Demographic structure can affect public health needs in at least three ways: (1) age structure and sex ratio affect the types of health problems encountered, (2) population growth rates affect future needs for health care delivery, and (3) the existence of substantial immigrant and refugee populations can also be important.
The health needs of a population differ considerably by age and by sex. A population’s history of birth and death rates changes the age structure in a way that is easy to predict. Generally, a fertility decline reduces the proportion of children in a population, while a decline in death rates increases life expectancy and the proportion of elderly in the population.
The United States provides a good illustration. During the baby boom period the age structure of the population was relatively “young” because birthrates were fairly high. A major emphasis of health care policy during that period was on prenatal and maternity care and on the health problems of mothers and children. In countries with even higher fertility rates, such as many African and some Asian countries, maternal and child health needs are even more of a priority because the proportion of the population at younger ages is even higher. During the last decades of the twentieth century, the population of the United States became older, on average. By 2025, a substantial and growing portion of the American population will be 65 and older. Therefore, health policy is increasingly being focused on the needs of the elderly.
The sex ratio can also affect health care needs. For most age groups, the sex ratio (that is the ratio of males to females) is close to equal. In general, however, men have higher death rates than women. As a result, at older ages sex ratios are generally much lower. That is, there are many fewer men than women. While women are likely to have longer life spans than men, they are also more likely to become widows and to have to care for themselves at older ages.
Population growth rates can affect the size and rate of growth in health care needs in a population. Specifically, provision of health services to a rapidly growing population is more difficult than to a population growing more slowly. In the United States, most policymakers seek to increase access to health services among the poor and underserved segments of the population. In developing countries, policymakers are even more concerned with expanding access to health services. Rapid population growth can make it difficult to continue to provide the same level of services to all segments of the population, and even harder to increase the level of health services available.
Consider two relatively poor countries, both of which have exactly 1 million people in 1990, as shown in Table 2. In 1990, each country is providing health services to 25 percent of the population, or 250,000 people, and each country has a goal of extending health care to cover 35 percent of the population by 1995. If Country A is growing at 3 percent per year and Country B is growing at 1.5 percent, Country A is going to have a harder time both maintaining 25 percent health-service coverage and expanding its health services to cover 35 percent of the population.
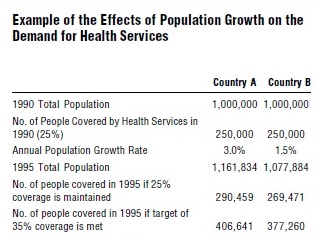
Table 2
To maintain health care coverage at a level of 25 percent, both countries will have to expand the number of people covered between 1990 and 1995 by training more personnel, building more facilities, and investing more in supplies and equipment. However, as Table 2 shows, Country B will have to cover only 19,471 more people in 1995 while Country A will have to cover an additional 40,459 people in order to maintain 25 percent coverage. To increase coverage to 35 percent, Country B will have to provide services to an additional 127,260 people while Country A will have to cover an additional 156,641 people. As this example shows, health planners need to take population growth rates into account when estimating the future health care needs of a population. The United Nations Population Division and the United States Census Bureau regularly produce population projections which can be used as guides to the likely future size and structure of a country’s or local area’s population.
With improvements in transportation and changing political and economic circumstances, immigration and emigration will be an important issue for the United States, and for most of the countries of the world, in the twenty-first century. Governments and international organizations generally divide immigrants into two groups: refugees, who are those fleeing their home countries because of political persecution or war; and labor or economic migrants, who go to other countries seeking employment and a better life. Refugees and economic migrants can move between two countries or within a single country. Note that the distinction between refugees and economic migrants is often not very clear. For example, migrants from a country facing severe drought may be fleeing to seek better economic opportunities and/or because they may face starvation and violence due to drought if they remain at home.
Immigrant populations, and particularly refugees, often pose important challenges for health planners and health-service providers. For example, recent immigrants may have little knowledge of the health care system or health and social service providers. They often arrive with a different set of health beliefs and they may face language and cultural barriers when seeking health care. Recent immigrants are also likely to have lower incomes and to be more vulnerable to downturns in economic conditions such as recessions. Although immigrants in established migration streams usually have a network of social and family contacts in the country then migrate to, recent migrants often live closer to the margin than long-term immigrant groups.
Refugees often have additional health problems because of the political persecution they have faced. Their special health needs may include psychological treatment for conditions such as post-traumatic stress disorder and depression, as well as treatment for infectious diseases, injuries, and malnutrition. Refugees, like other immigrants, may also face discrimination in employment or in access to health and social services in the country they migrate to, which is likely to affect their health status.
While many refugees settle in the United States or other industrialized countries, the majority (more than 80%) find asylum in developing countries in Africa, Asia, and Latin America, where health services are often poor. Refugees often face serious barriers to finding employment in countries of asylum for two reasons: (1) farm land is not readily available to outsiders, especially those without funds to purchase land, and (2) few jobs exist in other sectors of the economy. As a result, they can become dependent on international aid organizations for economic support, food aid, and health services. Examples of this situation during the 1990s include Cambodian refugee camps on the Thai-Cambodian border, Ethiopian refugees in Sudan and Somalia, Somalian refugees in Kenya, and Guatemalan and El Salvadoran refugees in Mexico.
Bibliography:
- Bongaarts, J. (1994). “Population Policy Options in the Developing World.” Science 263:771–776.
- Cohen, J. E. (1995). How Many People Can the Earth Support? New York: Norton.
- Foote, K. A.; Hill, K. H.; and Martin, L. G., eds., (1993). Demographic Change in Sun-Saharan Africa. Washington, DC: National Academy Press.
- Goliber, T. J. (1997). “Population and Reproductive Health in Sub-Saharan Africa.” Population Bulletin 52(4). Washington, DC: Population Reference Bureau.
- Hatcher, R. A.; Trussell, J.; Stewart, F.; Stewart, G. K.; Kowal, D.; Guest, F.; Cates, Jr., W.; and Policar, M. S. (1994). Contraceptive Technology. New York: Irvington.
- Lee, J., and Feng, W. (1999). “Malthusian Models and Chinese Realities: The Chinese Demographic System, 1700–2000.” Population and Development Review 25:33–65.
- Livi-Bacci, M. (1992). A Concise History of World Population. Cambridge, MA: Blackwell.
- Martin, P., and Midgley, E. (1999). “Immigration to the United States.” Population Bulletin, 54(2). Washington, DC: Population Reference Bureau.
- McFall, J. A., Jr. (1998). “Population: A Lively Introduction.” Population Bulletin 53 (3). Washington, DC: Population Reference Bureau.
- National Research Council (NRC), Panel on Population Projections, Committee on Population (2000). Beyond Six Billion: Forecasting the World’s Population. Washington, DC: National Academy Press.
- Pebley, A. R., and Rosero-Bixby, L., eds. (1997). Demographic Diversity and Change in the Central American Isthmus. Santa Monica, CA: RAND.
- Riche, M. F. (2000). “America’s Diversity and Growth: Signposts for the 21st Century.” Population Bulletin 55(2), Washington, DC: Population Reference Bureau.
- United Nations (1999). World Population Prospects: The 1998 Revision, Vol. I: Comprehensive Tables. New York: Population Division, Department of Economic and Social Affairs, United Nations.