Private health insurers play a large role in providing financial protection against the high cost of medical care in the United States. In 2010, approximately 64% of the overall US population had some form of private health insurance. The Centers for Medicare and Medicaid Services’ National Health Expenditure Accounts (NHEA) project that aggregate private health insurance premiums across all market segments will reach $888.6 billion in 2012. This article examines the performance of private insurers operating in the fully insured, US employer group and individual markets. Although many private insurers cover Medicare and Medicaid beneficiaries, and serve as third-party administrators for self-insured employers, this article does not consider these aspects of production.
Later in this article, the authors present a conceptual framework to introduce and link the health insurance concepts of premiums, profits, administrative costs, loading fees, and medical loss ratios (MLRs). Following this, it summarizes the empirical evidence on insurers’ performance with respect to premiums as well as loading fees and MLRs.
The types of private insurance demanded by individuals vary by their age and employment status as well as other factors. For individuals under the age of 65 years, the dominant form of coverage is employer-sponsored insurance (ESI). According to the Kaiser Family Foundation/HRET Survey, ESI premiums averaged $5 429 for single policies and $15 073 for family policies in 2011. ESI premiums have grown rapidly over the past decade and have contributed to the erosion of ESI, particularly among small employers. From the Medical Expenditure Panel Survey – Insurance Component, only 35.7% of private sector employers with fewer than 50 employees offered coverage in 2011, down from 47.2% in 2000.
Individuals who lack ESI may purchase coverage directly from an insurer. Nationally, the individual market is small relative to ESI, with an estimated 18.9 million (7%) nonelderly individuals reporting coverage purchased directly from an insurer based on the Annual Social and Economic Supplement to the 2010 Current Population Survey. Unlike ESI, persons demanding individual coverage often seek to bridge short-term coverage gaps, including the time period between two jobs, between school and a job, or between retirement and Medicare eligibility.
For the individual market, the average premium for single coverage was $2985, whereas it was $6328 for family coverage, based on a 2009 survey by America’s Health Insurance Plans, the national association representing the health insurance industry. Although reported premiums are often lower for individual policies relative to ESI, they typically have lower actuarial values, defined as the percentage of total average costs for benefits that the plan will cover. Actuarial values are directly affected through a plan’s cost-sharing provisions, including deductibles, coinsurance rates, and out-of-pocket maximum spending limits.
During the legislative debate over the Patient Protection and Affordable Care Act (ACA) of 2010, policymakers raised several concerns about the functioning of private health insurance markets and insurer behavior, particularly within the individual and small employer group markets. Central to this discussion was whether individuals and small businesses were getting poor value for their premiums because of insurers’ high administrative costs and excessive profits. With passage of the ACA, dramatic changes to US health insurance markets are expected. This article provides important baseline information and evidence regarding the performance of US health insurers in the ESI and individual markets.
Conceptual Framework For The Production Of Health Insurance
The premium charged by an insurer for a given level of coverage includes three basic components: expected claims, administrative expenses, and profit. Expected claims represent the amount of money that an insurer expects to pay hospitals, physicians, and other providers during the coverage period for the services incurred by a policyholder. Expected claims depend on both the negotiated prices between an insurer and providers as well as the types and quantities of medical services demanded. Expected claims are also related to the policy’s benefit design, including the size of the deductible if there is one, the level of coinsurance and/or copayments, and out-of-pocket maximum limits as well as the quantity and types of medical services covered by the policy.
Insurers incur expenses for several different types of administrative functions. These functions may include general administration, information technology, product development and provider network management (e.g., contracting), sales (e.g., marketing, agent or broker commissions, underwriting, enrollment, and member services), medical management (e.g., utilization review or case management for high cost enrollees), claims adjudication, and regulatory compliance. Insurers also incur expenses for premium taxes and fees. Finally, insurers are expected to incorporate some level of (normal) profit into the premium.
An insurer’s production can be summarized more formally. In a differentiated goods industry, like the market for health insurance, with similar but not identical products, one can assume, for simplicity, each firm f of F firms sells one product. The profits pf of firm f can be written as
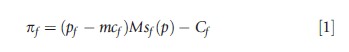
where pf is the price of firm f product, mcf is the marginal cost of production, M is the exogenously determined size of the market, sf(p) is the share of firm f product, where p is the vector of all firms’ prices, and Cf is the fixed cost of production. Average profits per policy can be expressed by dividing eqn [1] with the term Msf(p):
![]()
For health insurance products, pf is the premium of the policy (premf) and mcf includes expected claims paid out by the insurer (claimsf) and administrative expenses (adminf) per policy such that
![]()
Assuming for simplicity that the fixed costs are sunk, such that Cf=0, eqn [3] can be rewritten to obtain the standard health economics textbook expression for health insurance premiums:
![]()
The loading fee, Lf, represents the portion of the total premium above and beyond the actuarially fair value or expected claims to be received from the policy during the coverage period. Typically, the loading fee is modeled as a multiplier to expected claims:
![]()
For example, if the premium is $125 and expected claims total $100, the loading fee is 0.25 or 25%.
A closely related concept to the loading fee is the MLR. Before the passage of federal health reform, the MLR has been defined as the ratio of expected claims paid by the insurer to the premium. Expressing the loading fee as a multiplier of expected claims, the MLR can be written as follows:

A closely related concept to the loading fee is the MLR.
Several factors influence the performance of health insurers. Insurers typically sell multiple products and each product is defined by a set of attributes. Thus, insurance products are often differentiated within and across firms. Common ways in which insurance products differ include their actuarial value and benefit design, the breadth and reputation of their provider network, and the level of customer service provided. These factors contribute to insurers’ expected claims and loading fees. Although detailed information on product attributes may be easily observed for a single insurer, no comprehensive data source exists to facilitate analyses for the current population of US health insurers and their products.
Competition is another important factor affecting insurers’ performance. Economic theory predicts that stronger insurance market competition among homogenous products should lead to lower premiums, ceteris paribus. Also, to the extent that purchasers of insurance have greater market power, this may lead to lower premiums. The structure of upstream markets is important too. Because insurers negotiate with local hospitals and physician practices over reimbursement rates, more competitive provider markets may improve insurers’ leverage in negotiations and lead to lower input prices. Furthermore, for the individual and small employer market segments, brokers and agents play an important role in facilitating coverage purchases. Insurers’ commission schedules with brokers and agents may be affected by the extent of competition among them as well.
Over time, insurers’ premiums have followed a cyclic pattern. Called the underwriting cycle, this pattern reflects fluctuations in premiums and insurer profitability generated by decisions of firms to trade off profits for expanded market share. As noted by Grossman and Ginsburg (2004), several factors have contributed to the historical underwriting cycle, including the timing of forecasted cost trends relative to premium setting, the degree of insurance market competition, and the presence of not-for-profit insurers in the market.
Finally, the regulatory environment can affect insurers’ performance. Following a failed attempt to pass federal healthcare reform in 1993–94, many states passed legislation to improve the functioning of the small employer and individual markets for insurance. Prevalent forms of regulation include guaranteed issue, guaranteed renewability, and premium rating limitations (e.g., rate bands), as well as mandated benefits (e.g., mammography screening). Differences in state regulations of insurers have led to variation in many insurance market outcomes, including premiums, administrative expenses, and coverage.
Empirical Evidence On Insurer Performance
Within the empirical literature on health insurance production, many studies have investigated factors that help to explain variation in premiums, although not necessarily focusing on specific components. A smaller body of research has focused on estimating the size of insurers’ loading fees and/or MLRs. There is heightened awareness around the latter following implementation of federal minimum MLR regulation in 2011 as part of the ACA. Below, this article summarizes the empirical evidence on the factors that influence premiums as well as insurers’ loading fees and/or MLRs for the employer group and individual markets.
What Factors Influence Premiums?
Market Structure
Insurance market structure can be defined in a number of ways. Three of the most common measures include the total number of insurers operating in the relevant geographic and product market; a four-firm concentration ratio that provides the percentage of market share captured by the largest four firms in the market; and the Herfindahl–Hirschman Index (HHI), which is the sum of the squared market shares of the firms operating within the market, measured in percentage terms. The HHI has an upper bound of 10 000, corresponding to a monopoly.
Two studies have examined the influence of insurance market structure on premiums. Using a national sample of health maintenance organizations (HMOs) for the period 1988–91, Wholey et al. (1995) examined the relationship between premiums and the number of HMOs in the market. They found evidence that premiums were lower as the number of firms increased, providing support for advocates of managed competition. Also examining the effects of changes in market structure, Dafny et al. (2012) investigated whether consolidation in the US health insurance industry, driven by a large merger, led to higher ESI premiums. They found that real premiums have grown by two percentage points in a typical market due to an average market-level change in HHI of 698 points.
Karaca-Mandic et al. (2013a) recently investigated the effects of competition in the market for insurance agents and brokers on ESI premiums for small employers. Using the Medical Expenditure Panel Survey – Insurance Component and data from the National Association of Health Underwriters, the authors provide evidence that premiums of policies offered by small employers are lower in markets with stronger competition among insurance agents and brokers.
Effects Of Regulation
Several actuarial and econometric studies have examined the effects on premiums of state-level insurance regulations, including benefit mandates (e.g., coverage for mammograms, in vitro fertilization, or mental health services) and rating regulations. Monheit and Rizzo (2007) summarize this evidence. Overall, there is mixed evidence with respect to the effects of benefit mandates on premiums. Some studies suggest these mandates are associated with modest premium increases, whereas others find no relationship. Work by Kowalski et al. (2008) focused on the relationship between state regulations implemented during the 1990s and premiums, including benefit mandates, guaranteed issue, community rating, guaranteed renewability, any-willing-provider laws, and individual market premiums. Using data from eHealthinsurance and Golden Rule, they found evidence that community rating regulations raised premiums and that the rate of increase was substantially higher if guaranteed issue regulations accompanied community rating regulations.
Other Factors
Within the literature, a number of studies have documented variation in premiums by state, firm size, and plan type. Some studies have also examined premium variation over time within the context of the underwriting cycle and found evidence that insurers respond to a higher prior-year MLR (higher fraction of claims relative to premiums) by raising premiums in the next year (Born and Santerre, 2008). Using a proprietary data set of large employers, Dafny (2010) examine ESI premium setting and found that insurers engage in ‘direct’ price discrimination, charging higher premiums to firms with deeper pockets, as measured by operating profits. Finally, KaracaMandic et al. (2013a,b) use panel data for 2001–09 from the National Association of Insurance Commissioners (NAIC) to analyze the factors explaining variation in premiums per member month (PPMM) of coverage in the individual market. They found that insurers operating in other market segments, including the group and Medigap markets, had higher PPMM, whereas those operating in the Medicaid market had lower PPMM. They also documented differences in premiums by whether the insurer is local, regional, or national; whether the insurer is an HMO; and the size of the insurer as measured by the total number of member months of coverage.
What Is The Evidence On Loading Fees, Medical Loss Ratios, And Their Components?
The health insurance loading fee represents the portion of the premium above the expected claims paid by the insurance company. The loading fee includes general and claims-related administrative expenses, profits, broker commissions, and other sales-related expenses, and corresponds to the cost of transferring part of the risk-bearing from the individual to the insurer. According to the conventional theory of insurance, a risk-averse individual is willing to pay for a premium above the expected claims, and thus the size of the load reflects the value of a certain amount of income over an uncertain one with the same expected magnitude. Therefore, under the conventional theory, one can think of the loading fee as the ‘relevant price’ of the health insurance policy (Phelps, 2010), and therefore, a key factor when considering the value of coverage. In Nyman’s theory of insurance, which does not rely on risk aversion to explain why individuals purchase insurance, premium is a more relevant price of insurance as it embodies the amount of non-health-related goods an individual gives up when healthy to receive an income transfer when sick (Nyman, 2003).
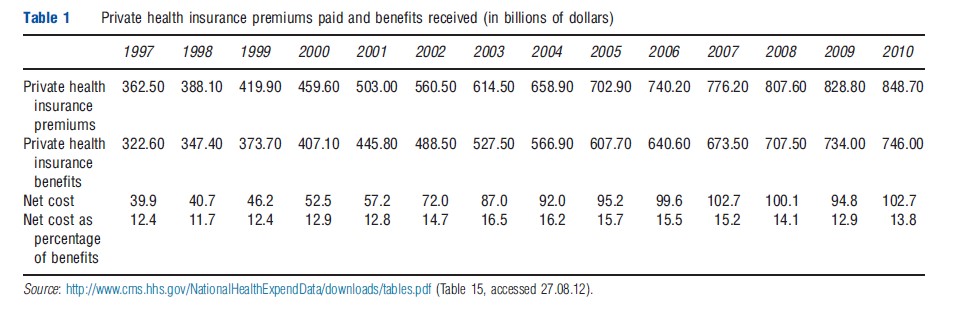
As a crude approximation to capture the extent of administrative costs and other fees associated with private insurance provision, the Centers for Medicare and Medicaid Services’ Office of the Actuary estimates the net cost of private health insurance as the difference between the private health insurance premiums paid and benefits received in the NHEA. Table 1 documents the net cost of private insurance as a percentage of private insurance benefits paid. As one can see, this percentage has remained relatively stable in the 12%–16.5% range during the 1997–2010 period. These statistics represent an average measure, without distinguishing among ESI (overall or across employer group sizes), individual market coverage, or supplemental Medicare insurance products.
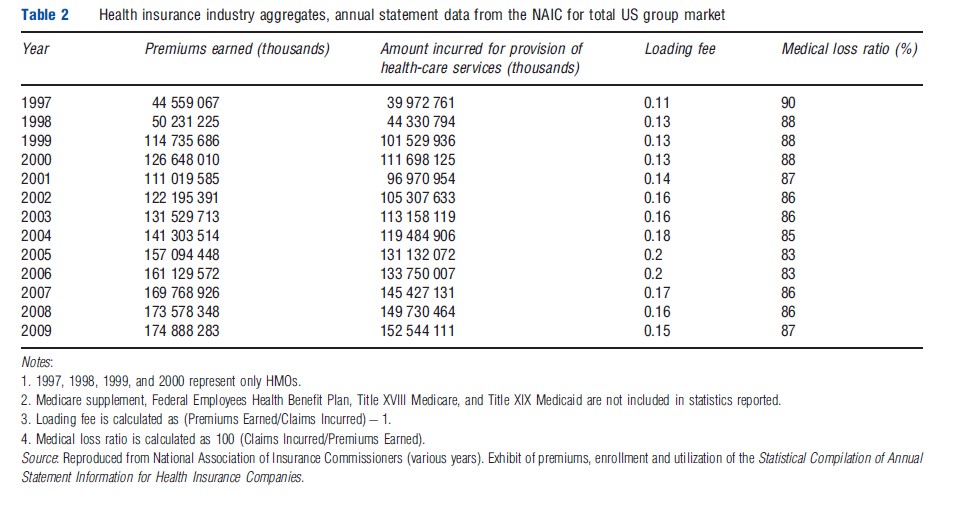
The NAIC is the organization of insurance regulators from the 50 states, the District of Columbia, and the five US territories. It has one of the world’s largest insurance industry databases, which are regularly used by industry leaders to determine market share, conduct market research, and monitor industry trends. The NAIC also publishes aggregate annual data separately by market segment (individual, group, supplemental Medicare, etc). Table 2 presents data from the Statistical Compilation of Annual Statement Information for Health Insurance Companies published by the NAIC for the aggregate US group market. These statistics also do not distinguish by employer group size, but indicate that overall loading fees for the group market ranged between 11% and 20% for the 1997–2008 period. The MLR, defined as the percentage of premiums spent on clinical services, ranged between 83% and 90% during the same time period.
As noted in the section ‘Introduction,’ small employers are much less likely to offer health insurance relative to large employers. One explanation for this pattern is that employer groups face different loading fees. Thorpe (1992) posits several reasons why this might occur. Differences in transaction costs are one possible reason. Given the fixed costs of marketing and underwriting (in states where it is allowed), small employer groups are more expensive on a per-employee basis relative to larger ones. Furthermore, because small employers exhibit greater price sensitivity in their demand for insurance, they may be more likely to switch insurers as prices change, leading to additional expenses for marketing and underwriting over time. Third, given the voluntary nature of the market, insurers often express concern about the potential for adverse selection among small employers, and in turn, this may lead to higher risk premia.
The most commonly reported set of loading fee estimates by firm size dates back to two decades when an actuarial study was prepared by the Hay/Huggins Company for the US Congress’ House Committee on Education and Labor in 1988. These estimates reflected the underwriting practices of major insurers, and suggested loading fees of approximately 40% for the very smallest firms (1–4 employees), 25% for those slightly larger (20–49 employees), and 18% for those with 50–99 employees. Hay/Huggins also reported that fees decline to 16% for those with 100–499 employees and to 12% for those up to 2500 employees. These estimates from the 1980s are still referenced frequently in the literature, including current health economics and health insurance texts.
In recent work, Karaca-Mandic et al. (2011) generated new estimates on the size of loading fees and how they differ across the firm size distribution using data from the confidential MEPS Household Component–Insurance Component Linked File. Overall, they found that firms of up to 100 employees face similar loading fees of approximately 34%. Loads decline with firm size and are estimated to be on average 15% for firms with between 101 and 10 000 employees and 4% for firms with more than 10 000 employees.
Focusing specifically on the individual market, Pauly and Nichols (2002) used NAIC data for the period 1988–99 and reported that expenses related to administration, sales, and risk-bearing represented between 30% and 40% of the premiums for individual market insurance. More recently, Abraham and Karaca-Mandic (2011) examined variation in MLRs among US health insurers in the individual market using NAIC data from 2002, 2005, and 2009. The authors documented large variation in MLRs by state, with enrollment- weighted average MLRs ranging from 0.629 in New Hampshire to values greater than 1 in Alabama, Massachusetts, Michigan, and North Dakota in 2009. Additionally, they estimated that 29% of insurer-state observations in the individual market would have MLRs (based on the historical definition) below the 80% minimum threshold imposed by the new ACA regulations, corresponding to 32% of individual market enrollment.
In 2011, a study by the General Accounting Office (GAO, 2011) analyzed insurers’ MLRs in the individual and group markets using 2010 data and employing ACA MLR standards, which include adjustments for quality improvement expenses, federal and state taxes and licensing/regulatory fees, and life-years of enrollment. For the individual market, they found wide variation in MLRs, with only 43% of credible insurers and 48% of covered lives at or above the 2011 standard. For the small and group markets, these percentages were notably higher.
Although these studies provide valuable descriptive information, there is little empirical research to understand the factors that explain variation in insurers’ loading fees or MLRs. A study by Karaca-Mandic et al. (2013b) investigates the determinants of MLR variation in the individual market over the 2001–09 time period. They evaluated how MLRs are influenced by changes in the composition of insurer and provider markets, the employer size distribution, and the demographic and health status of the population. Results suggest that insurance market structure is inversely related to MLRs. Insurers in markets in which they are the only credible insurer have lower MLRs, on average. This is consistent with such firms having higher market power. Here the classification of being a ‘credible’ insurer refers to having at least 1000 member-years of coverage as stipulated by federal regulations. Although the predicted average MLR is 77% for an insurer that is the only credible firm in the insurance market, it is 82% for an insurer with 2–4 other credible firms in the market, and 83% for an insurer with 5 or more credible firms in the market.
Conclusion
This article summarizes current evidence on US health insurers’ performance in the ESI and individual markets, providing important baseline information about premiums as well as loading fees and MLRs. Dramatic changes to US health insurance markets and insurers’ performance are expected as a result of the Patient Protection and ACA of 2010. In 2014, insurance exchanges will be implemented and will serve as organized marketplaces through which individuals and small employers can buy coverage. Exchanges will also be a primary mechanism through which coverage will be expanded to millions of uninsured, lower-income Americans who lack access to affordable ESI options. Finally, insurers are adjusting to a very different regulatory environment created by the ACA, including minimum MLR regulation and premium rate review enacted in 2011, as well as several major changes to benefit designs, the adoption of modified community rating, and the requirement that most individuals obtain health insurance in the United States beginning in 2014.
References:
- Abraham, J. and Karaca-Mandic, P. (2011). Regulating the medical loss ratio: Implications for the individual market. American Journal of Managed Care 17, 211–224.
- Born, P. and Santerre, R. (2008). Unraveling the health insurance underwriting cycle. Journal of Insurance Regulation 66–84. Spring.
- Dafny, L. (2010). Are health insurance markets competitive? American Economic Review 100(4), 1399–1431.
- Dafny, L., Duggan, M. and Ramanarayanan, S. (2012). Paying a premium on your premium? Consolidation in the U.S. health insurance industry. American Economic Review 102(2), 1161–1185.
- GAO (2011). Private health insurance early experiences implementing new medical loss ratio requirements. Available at: http://www.gao.gov/new.items/d11711.pdf (accessed 26.07.13).
- Grossman, J. and Ginsburg, P. (2004). As the health insurance underwriting cycle turns: What next? Health Affairs 23(6), 91–102.
- Karaca-Mandic, P., Abraham, J. and Phelps, C. (2011). How do health insurance loading fees vary by group size? Implications for healthcare reform. International Journal of Health Care Finance and Economics 11(3), 181–207.
- Karaca-Mandic, P., Abraham, J. and Simon, K. (2013b). Is the medical loss ratio a good proxy for market power in the individual market for health insurance? University of Minnesota Working Paper.
- Karaca-Mandic, P., Feldman, R. and Graven, P. (2013a). The role of agents and brokers in the market for health insurance. University of Minnesota Working Paper.
- Kowalski, A. E., Congdon, W. J. and Showalter, M. H. (2008). State health insurance regulations and the price of high-deductible policies. Forum for Health Economics and Policy 11, 8.
- Monheit, A. C. and Rizzo, J. (2007). Mandated health insurance benefits: A critical review of the literature. Department of Human Services. Technical Report. New Jersey. Available at: http://www.cshp.rutgers.edu/Downloads/7130.pdf (accessed 26.07.13).
- Nyman, J. (2003). The theory of demand for insurance. Stanford, CA: Stanford University Press.
- Pauly, M. and Nichols, L. M. (2002). The non-group health insurance market: Short on facts, long on opinions and policy disputes. Health Affairs Web Exclusive
- Phelps, C. (2010). Health economics. Reading, MA: Addison-Wesley. Available at: http://content.healthaffairs.org/content/early/2002/10/23/hlthaff.w2.325.full.pdf (accessed 26.07.13).
- Thorpe, K. E. (1992). Inside the black box of administrative costs. Health Affairs 11(2), 41–55.
- Wholey, D., Feldman, R. and Christianson, J. (1995). The effect of market structure on HMO premiums. Journal of Health Economics 14, 81–105.
- http://www.naic.org/ National Association of Insurance Commissioners.
- http://www.cms.hhs.gov/NationalHealthExpendData/downloads/tables.pdf National Health Expenditure Accounts.
- http://www.cms.gov/Research-Statistics-Data-and-Systems/Statistics-Trends-andReports/NationalHealthExpendData/Downloads/Proj2011PDF.pdf National Health Expenditure Projections for the United States.