Introduction
The typical analysis of health insurance and service use considers coverage for a single aggregate commodity, ‘health care.’ It is natural to extend the analysis to more than one service, raising a number of issues in health insurance design. Fundamentally, two covered services can be substitutes or complements. ‘Offset effects,’ a term common in the empirical literature, refers to the substitute case, when use of one service ‘offsets’ or reduces use of another. The main insight regarding optimal insurance with multiple services is straightforward: When one service substitutes for another covered service, the increase in demand from insurance generates an efficiency gain from the decreased use of the other covered service. The reason for this is that the other service is itself insured and therefore to a degree ‘overused.’ The underappreciated subtlety in this result is the role of coverage for the ‘other’ service. Without coverage and overuse, there is no efficiency gain/loss with a change in demand for the other service. The role of coverage emerges in the analysis of multiple services, and has important implications for the way ‘offset effects’ should be measured and interpreted.
Concern about multiple services and substitutability and complementarity in insurance design need only be concerned with relationships with other covered services. Other services, if these are not part of the insurance plan even if they are health care services, are irrelevant for questions of optimal insurance. For example, suppose coverage for a certain prescription drug for pain offsets use of over-the-counter analgesics. Because these are not insured, there is no inefficiency associated with their use, and any ‘offset’ in the use of over-the-counter drugs is irrelevant for insurance design.
Coverage for the ‘other good’ plays a role in the empirical literature studying cross effects in demand. A large literature in health economics and health services research tests for ‘offset effects.’ The most active area for current research is on the cross effect of coverage for prescription drugs. Drug coverage is relatively new and variable. Furthermore, effective drug treatment for many, particularly chronic illnesses, might reasonably be expected to prevent/offset the need for other forms of care.
A related question is insurance coverage for ‘prevention,’ health care that affects the probability of illness. The argument for coverage for preventive services is similar to the offset argument, and rests on the presence of coverage of the service for the illness that would be prevented.
The article begins with a brief review of some of the empirical literature on offset effects, and then considers the issue from the standpoint of welfare economics and insurance design.
Empirical Literature Cross Elasticities
Much of the empirical research on cross elasticities in health care has focused on drugs. Ellison et al. (1997) studied cephalosporins, a class of anti-infectives, using IMS monthly time series data from 1985 to 1991, and found significant elasticities between some therapeutic substitutes. More recently, Ridley (2009) investigated cross-price elasticities for antiulcer drugs and drugs to treat migraines using data for 3 million people from a large pharmacy benefit manager (PBM) in the early 2000s. He found large effects on demand when drugs differed in the co-payment from other drugs in their class.
A particularly interesting case of a cross elasticity has emerged in statins, used to treat high cholesterol. In June 2006, the second largest-selling statin, Zocor, became available as generic simvastatin. Statin drugs had very high sales. In 2004, Zocor was the fifth largest selling drug worldwide in terms of dollar sales, and another statin, Lipitor, was the worldwide leader among all drugs from any class greater than $12 billion of sales annually. In response to the availability of generic simvastatin, managed care plans moved Lipitor to higher (less favorable) tiers (Aitken et al., 2008 p. W157). One PBM moved Lipitor to tier 3 in January, 2006 in anticipation of generic simvastatin, and saw more than 40% of patients switch from Lipitor to a lower-tier statin (Cox et al., 2007). Among those with co-payment differences of $21 or more, 80% switched.
It is typical in this literature to measure the ‘offset effect’ by the effect on total spending not just covered or plan spending on the ‘other service.’ For example, Shang and Goldman (2007) use Medicare Current Beneficiary Survey (MCBS) data from 1992 to 2000 to show that extra spending, measured by plan plus consumer medical costs, on drugs use induced by Medigap coverage, is more than offset by reductions in total health care spending. Hsu et al. (2006) compared medical spending for Medicare beneficiaries with a cap on drug coverage to those without a cap at Kaiser Permanente of Northern California before Medicare Part D. Drug spending was 28% less in the capped group but other categories of expenditures were higher and total spending for all care was not significantly different between the groups, implying a near dollar-for-dollar offset in total costs. Gaynor et al. (2007) studied the effect of increases in co-payments charged for drugs among private employees on total (plan plus consumer) spending. Increases in nondrug spending, largely in outpatient care, offset $0.35 of each dollar saved in drug costs. An exception to the singular focus on total spending is the paper by Chandra et al. (2010), finding that the savings in costs due to higher co-payments for drugs were partly offset by higher spending on hospital services among retired state employees in California. They tracked offsets by payer because a primary (Medicare) and secondary (employer-provided supplemental) shared in offsets unequally. Approximately 20% of the cost savings from higher cost sharing for physician services and drugs was ‘offset’ by higher costs of hospitalization overall, with the offset concentrated among those with a chronic illness. Interestingly, as the authors point out, in the CalPERS case, this offset largely takes the form of a negative fiscal externality from the CalPERS supplemental policy (which saves from the elevated copayments) to Medicare (which pays most of the costs of hospitalization).
The implicit logic in offset papers is that if total medical costs fall due to an increase in coverage, then the change in coverage is welfare improving (i.e., ‘pays for itself’). This article argues that change in total medical spending, meaning the sum of plan and patient out-of-pocket spending, is not the right measure of the economic value (or cost) of a change in insurance coverage due to offset effects. Rather, changes in health plan costs alone measure the economic value of savings due to reductions in the use of other services. Applying methods reviewed by Chetty (2009) and Glazer and McGuire (2012) showed that a ‘sufficient statistic’ for evaluating the welfare effect of change in coverage for one that is good is the change in total plan-paid costs less the change in costs transferred to/from consumers. They derived an elasticity rule for when the offset effects of an improvement in coverage increases welfare.
A simple argument shows why total costs are not the right welfare measure of an offset effect. Suppose the plan covers just one service, ‘health care,’ and an increase in coverage of health care increases a consumer’s total expenditures on health care. The consumer budget constraint implies that spending on some other noncovered services has to fall. This ‘offset’ says nothing about efficiency because coverage expansions are always exactly ‘offset’ in this trivial sense. What if the other affected spending were on another form of health care that was minimally covered in the plan, say for 1% of costs with consumers paying 99%? Logically, token coverage cannot imply that the full spending change as an offset should be counted.
A Model Of Offsets In Health Insurance
Suppose a health plan covers services 1 and 2. Quantity of each received by a representative individual in the plan is x1 and x2 measured in dollars. Benefits to the individual are B(x1,x2), where Bi≥0, Bii<0, i = 1,2, with subscripts indicating partial derivatives. Letting ci denote the co-payment charged for each unit of service i, then the individual demands service I to satisfy:
![]()
Let R denote the plan premium paid by the enrollee. Assuming the plan makes zero profit, the premium is
![]()
where (x1,x2) are given by eqn [1].
The individual’s total utility from the plan is thus
![]()
where (x1,x2) are from eqn [1] and R is from eqn [2]. Substituting for R to recognize that the individual pays for services by a combination of the cost sharing and the premium:
![]()
Consider now what happens to utility (welfare) eqn [3b] if the plan were to change the co-payment for service 2:
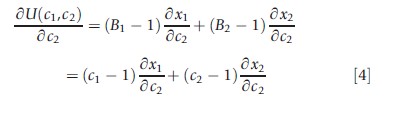
The second equality follows from eqn [1].
Suppose co-payment for service 2 is reduced. If δx1 /δc2 >0, there is an offset effect and consumption of x1 falls with this change. What happens to welfare? Equation [4] tells us how to value the offset. Reversing the sign of eqn [4] to get an expression in terms of plan shares, when co-payment for service 2 goes up (down), utility of the individual goes up (down) if and only if eqn [5] holds:

The intuition for this result is the following: The second term on the left-hand side of the inequality captures the inefficiency in consumption induced by the reduction in copayment for service 2. With health insurance, the marginal benefit of health care is less than the marginal cost (B2 = c2<1), and the extra consumption of x2 due to the reduction in co-pay creates additional welfare loss. In the conventional analysis of optimal health insurance, this welfare loss is weighted against the risk spreading gain to find the optimal co-payment, c2. The first term on the left-hand side in eqn [5] is the offset effect due to the change in consumption (in this case reduction) of x1. Just as with the own-price effect, benefits and costs both matter in valuing welfare of any offset effect. The 1(δx1/δc2) part is the reduction in total cost from the change in x1 and, because B1= c1, the-c1 (δx1/δc2) part is the loss in benefits. Thus, the net welfare measure of offset effects is plan’s savings: (1-c1) δx1/δc2.
Changes in (consumer’s) welfare to changes in plan costs can now be related. From eqn [2] it is known that when copayment for service 2 changes, the change in the plan costs is given by
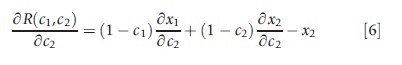
Equation [4] for changes in welfare, and eqn [6] for changes in plan costs, are the same except for the presence of x2, the cost shifting effect of a change in c2, a transfer ultimately paid by the consumer in any case. Using eqns [4] and [6] a rule for a welfare change, in terms of changes in plan-paid costs, can be stated.
Rule For Welfare Effects
The welfare effect of a change in coverage is equal to minus the change in plan costs net of the cost-shifting effect of the coverage change.
Proof. From eqns [4] and [6] the result is
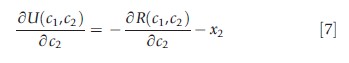
This rule for welfare effects constitutes, in Chetty’s (2009) term, a ‘sufficient statistic’ for welfare evaluation of health insurance changes. The measure, change in plan costs less cost shifting, is equal to the welfare change, and thus yields an ‘if and only if rule’: Welfare goes up if and only if plan costs less transfers go down.
The rule brought out in this article can be used to interpret the existing logic of the offset literature which focuses on total costs, plan paid plus patient paid, and concludes that an improvement in coverage for good 2 is worthwhile if it ‘pays for itself’ in savings on good 1. Consider a reduction in c2 that decreases use of covered good x1 (an offset effect). Suppose the improvement in coverage for x2 ‘pays for itself’ in the sense that the reduction in the total cost of x1 exceeds the increase in plan costs for x2. This rule tells us that this condition is neither necessary nor sufficient for an increase in welfare. It is not necessary because the cost-shifting effect of the change in c2 is disregarded for welfare. It is not sufficient because it is not total costs that measure the value of the offset, but plan-paid costs. Instead of looking for a coverage improvement to ‘pay for itself,’ the following simple rule, expressed in terms of demand elasticities for when an improvement in coverage improves welfare via an offset effect, is proposed.
A Simple Rule For When Offsets Increase Welfare
Welfare goes up with a decrease in c2 (improvement in coverage) when the partial derivative in eqn [4] is negative, or alternatively

Putting this in elasticity form and dividing through by – ε22 (a positive number), the criterion for a welfare improvement with a decrease in c2 becomes
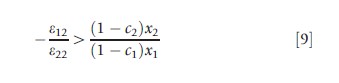
In eqn [9], ε12 is the cross and ε22 is the own-price elasticity with respect to c2. The RHS of eqn [9] is positive and equal to the ratio of plan paid costs for service 2 to service 1. The following rule can now be stated: For a decrease in c2 to improve welfare, the goods must be substitutes (ε12>0); and the ratio of the absolute values of the cross to the own-price elasticity must exceed the ratio of the plan paid costs for the two services.
The offset rule for welfare is simple to apply. Suppose it is known that the own-price elasticity of drugs is -1.0 and the cross-price elasticity for hospital services is +0.2. If the plan paid drug costs are less than 20% of the plan-paid hospital costs, an improvement in coverage for drugs improves welfare.
Attention to plan rather than total cost can change the tenor of the policy implications of offset effects, particularly for drug coverage where plan shares are relatively small. Turning to some results in significant recent offset papers illustrates the quantitative importance of the plan-cost perspective. Comparing the change in total costs for drugs and hospitals, Chandra et al. (2010, p. 208) found that a decrease in coverage for drugs reduced total drug costs by $23.06 per member per month, but increased total hospital costs by only $7.23 – the offset amounted to only a 1:3 ratio of hospital cost increases to drug cost savings, and in the authors’ judgment was ‘unlikely to be enough’ to reverse the perceived value of the co-payment increase. However, taking the plan rather than total cost perspective it can be said that because drugs are covered at roughly 50% and hospital cost at 100%, the offset ratio doubles, to approximately 2 to 3. It should be noted here that the California change studied in Chandra et al. (2010) also involved increases to outpatient co-pays, which are ignored in this illustrative example. These increases also saved money, making the offset ratio 1:5. By ignoring this other benefit change in this discussion, it is, in effect, assumed that it is the drug coverage change that causes the offset.
Final Comments
In applied policy research, offset effects played an important role in the discussion about the design of optimal health insurance for mental health treatment, and more recently they do so in the case of coverage for drugs. Most public and private plans cover drugs, but the coverage is partial in the sense that a drug formulary typically excludes many drugs, and for those drugs that are covered, the percent paid by the plan is much less than for other health care services. Interestingly, the copayment for generic drugs is often so high that it exceeds the acquisition cost to the health plan. The ideas in this article about valuing offset effects have the most current direct application to the question of coverage for drugs. If health insurance markets worked perfectly, competition would maximize welfare of the representative consumer, implying the efficiency issues discussed here would be taken care of in competitive equilibrium. Health insurance markets are fraught with sources of market failure, however, such as moral hazard, adverse selection, imperfect competition, externalities due to the participation of multiple insurers, as well as concerns about equity. In many cases there can be little assurance that market forces alone will lead to optimal coverage, leaving a role for calculations of the type illustrated here.
The major limitation of this rule for offsets and model setup generally, stems from the assumption that quantity is determined by the equality of marginal benefit to the consumer/patient and patient co-payment. Although the standard demand model is widely applied in theoretical and empirical health care research, it is also seriously questioned as a basis for describing the outcome of patient–provider interactions. Effective physician agency on behalf of the patient would be consistent with this approach, but it is acknowledged that the marginal benefit–marginal cost equality is still a strong assumption. Relatedly, health economists doubt whether consumer demand should be interpreted as marginal benefit when assessing the efficiency of changing coverage. Perspectives from ‘value-based insurance design’ and behavioral economics both question the conventional welfare framework for assessing the efficiency cost of added coverage for a service.
Bibliography:
- Aitken, M., Berndt, E. and Cutler, D. (2008). Prescription drug spending trends in the United States: Looking beyond the turning point. Health Affairs 28(1), W151–W160.
- Chandra, A., Gruber, J. and McKnight, R. (2010). Patient cost-sharing, hospitalization offsets in the elderly. American Economic Review 100(1), 193–213.
- Chetty, R. (2009). Sufficient statistics for welfare analysis: A bridge between structural and reduced-form methods. Annual Review of Economics 1, 451–487.
- Cox, E., Klukarni, A. and Henderson, R. (2007). Impact of patient and plan design factors on switching to preferred statin therapy. The Annals of Pharmacotherapy 41, 1946–1953.
- Ellison, S., Cockburn, I., Grilichres, Z. and Hausman, J. (1997). Characteristics of demand for pharmaceutical products: An examination of four cephalosporins. RAND Journal of Economics 28(3), 426–446.
- Gaynor, M., Li, J. and Vogt, W. B. (2007). Substitution, spending offsets, and prescription drug benefit design. Forum for Health Economics and Policy 10(2), 1–31.
- Glazer, J. and McGuire, T. G. (2012). A welfare measure of ‘offset effects’ in health insurance. Journal of Public Economics 96, 520–523.
- Hsu, J., Price, M., Huang, J., et al. (2006). Unintended consequences of caps on Medicare drug benefits. New England Journal of Medicine 354(22), 2349–2359.
- Ridley, D. (2009). Payments, promotion and the purple pill. Fuqua School of Business, Duke University, unpublished.
- Shang, B. and Goldman, D. P. (2007). Prescription drug coverage and elderly medicare spending, NBER working paper 13358. Available at: https://www.nber.org/papers/w13358.
- Duggan, M. (2005). Do new prescriptions pay for themselves? The case of secondgeneration antipsychotics. Journal of Health Economics 24(1), 1–31.
- Gibson, T. B., Mark, T. L., Axelsen, K., et al. (2006). Impact of statin copayments on adherence and medical care utilization and expenditures. American Journal of Managed Care 12, SP11–SP19.
- Goldman, D. P., Joyce, G. F. and Karaca-Mandic, P. (2006). Varying pharmacy benefits with clinical status: The case of cholesterol-lowering therapy. American Journal of Managed Care 12(1), 21–28.