In medical decision analysis and economic evaluation of health care, states of illness or disability (hereafter called ‘health states’) are commonly valued on a scale from zero to unity. A value of 0 is assigned to the state of being dead (or a state equivalent to being dead), whereas a value of 1 is assigned to ‘full health.’ The values are called preference scores or utilities and may be used to weigh life years in evaluations of health outcomes. Several techniques can be used to elicit values for health states from individuals, including the standard gamble (SG), time trade-off (TTO), rating scale, magnitude estimation (ME), person trade-off (PTO), Thurstone scaling, and extensions of this latent scaling model, the class of discrete choice (DC) models. They are based on different theoretical assumptions and stemming from different disciplines (e.g., health economics, psychology, and public health). Empirical studies on the relationship between the outcomes of these valuation techniques have shown that there are differences in the values elicited by the different valuation techniques and in their measurement properties. So far, there is little agreement about which technique is the most appropriate.
For health state values to be useful to decision makers, the numbers should accurately represent the genuine value or attitude of the subjects from whom they were elicited toward the health states in question. The extent to which this is the case depends on the psychometric or measurement properties of the elicitation techniques used to establish the values. In the context of health economics, the most salient psychometric properties are validity and reliability. From the area of clinimetrics the concept ‘responsiveness’ has been introduced as an important property of health outcome measures. More general is the idea of ‘level of measurement,’ which is related to the field of measurement theory, and that is more directed on the information level of the responses captured by various measurement approaches. This article explains what is meant by each of these and reviews the valuation techniques mentioned above with respect to these properties.
This overview is only dealing with valuation of health states derived from a group of respondents. In the area of clinical decision making, often individual patients are involved in eliciting values for health states that concerns possible outcomes related to their own disease and optional treatment modalities. The measurement properties of these patient values will not be discussed and presented in this article. The main reason for refraining to incorporate these types of values is because many measurement properties cannot be (directly) estimated on an individual basis or are rarely performed.
Validity
Validity refers to the degree to which an instrument really measures what it intends to measure. Another definition used in educational and psychological testing is that it is an overall assessment of the degree to which evidence and theory support the interpretation of the scores entailed by proposed uses of the instrument. Validity is thus concerned with the nature of ‘reality’ and the nature of the entity being measured. Especially for (partly) subjective phenomena, such as the valuation of health states, the determination of validity seems to be a process that involves the incremental accumulation of evidence rather than one definitive comparison. As opposed to outcomes such as temperature, blood pressure, or survival, health status is not directly observable and its appraisal is to some extent normative.
Validity encompasses three main aspects each with a rather broad scope: content validity, criterion-related validity, and construct validity. Content validity refers to the question: ‘Is the instrument really measuring what we intend to measure?’ For the purpose of this study, this implies a discussion about the ‘real’ meaning and interpretation of values elicited by valuation methods. Are they really representing individual expressions of health state preference? Criterion-related validity is only applicable if one method can be identified as superior, i.e., a ‘gold standard.’ As these issues are part of an ongoing debate, content and criterion-related validity are not addressed. Here convergent validity which may be regarded as a type of construct validity is primarily dealt with. In convergent validity research, the degree of association (i.e., correlation coefficients) between measures of constructs that theoretically should be related to each other is estimated, that is, patterns of intercorrelations among measures are looked at. Correlations between theoretically similar measures should be ‘high.’ A detailed discussion about the validity in valuation techniques, which revolves around the content of the HRQoL concept, would go beyond the scope of this article.
Convergent Validity
A variety of relationships between values from different valuation techniques has been reported in the literature. From these studies it is clear that the different valuation techniques produce different value functions. In general, SG and TTO values are all higher than visual analog scale (VAS) values. Under highly controlled experimental circumstances, a study by Krabbe et al. (1997) showed that in students the SG and the TTO are producing equivalent valuations to a large extent, despite their apparent conceptual difference. Results from this study can be compared with the few existing studies that have examined this issue, taking into consideration (Figure 1) that in the latter studies the numbers of health states and/or participants have usually been small and the statistical techniques rather global. A paper by George Torrance published in 1976 showed a coefficient of determination (R2) of 0.95 between SG and TTO. These coefficients are based on the mean values of only six health states assessed by local alumni of McMaster University. In Torrance’s study, the very bad and the very good health states were excluded, which may have improved the coefficients. Comparison of mean values obtained (from a set, N ¼ 52, of physicians, therapists, family members, and patients) with the SG and the TTO for 35 disability levels in a study conducted by Alan Wolfson and colleagues in 1982 resulted in an R2 of 0.84. In 1984, Leighton Read and colleagues presented a Pearson correlation coefficient of 0.65 between the SG and the TTO based on assessments made by 67 physicians. Their study was based on the valuation of only two health states. John Hornberger and colleagues in 1992 reported a Spearman rank correlation of 0.31 between the SG and the TTO. Their results were based on 58 individual patients’ valuations of their own health. Comparisons of these methods are inevitably problematic as the techniques used vary across studies (study design, framing) as well as mechanisms for transforming raw values, such as done not only for the TTO (states worse than dead) but also for the VAS (based on position of ‘dead’).
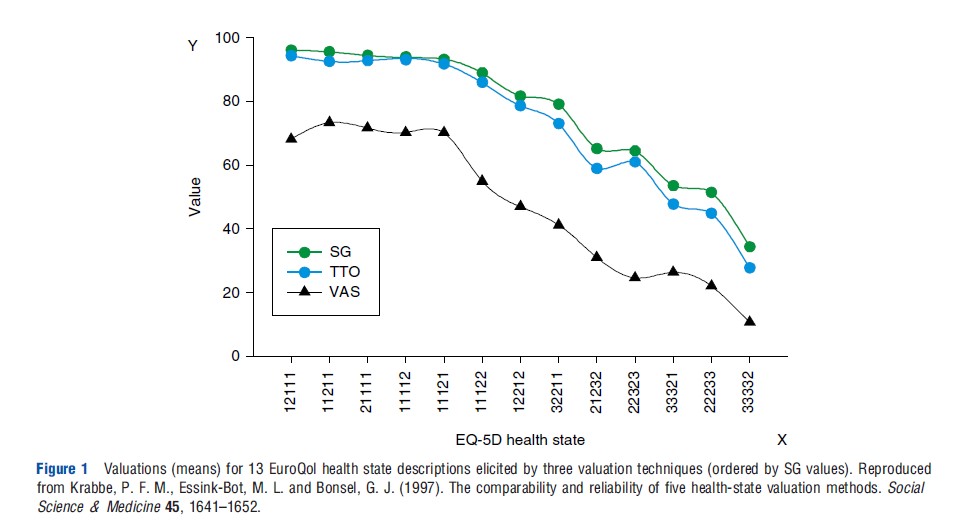
In the earlier mentioned study of Krabbe et al. (1997), valuations based on a VAS (a type of rating scale) were distinct from, but strongly related to, values derived from the two tradeoff methods. A simple one-parameter power function sufficed to transform VAS values to SG or TTO. A smaller study by Eric Bass and colleagues from 1994, focused on deriving values for health states in gallstone disease, demonstrated a consistent and substantial difference between values derived by a rating scale technique and those obtained by an SG technique.
In the rise of health state valuation techniques (late 1970s and early 1980s), some studies have been investigating ME. The most well-known one is probably the study by Rachel Rosser and Paul Kind from 1978. However, in this study, ME was not compared with another valuation technique. One year later in 1979, Robert Kaplan and colleagues showed that ME responses are compressed at the lower end of scale near death, which seems inconsistent with their VAS results.
In one of the rare studies focused on the comparison of PTO with other valuation methods, Joshua Salomon and Christopher Murray performed in 2004 a head-to-head study in which they calculated the following Spearman’s rank correlations based on responses from 69 public health professionals: PTO versus VAS 0.85, PTO versus TTO 0.84, and PTO versus SG 0.86. For the other combinations they found: VAS versus TTO 0.94, VAS versus SG 0.94, and TTO versus SG 0.92.
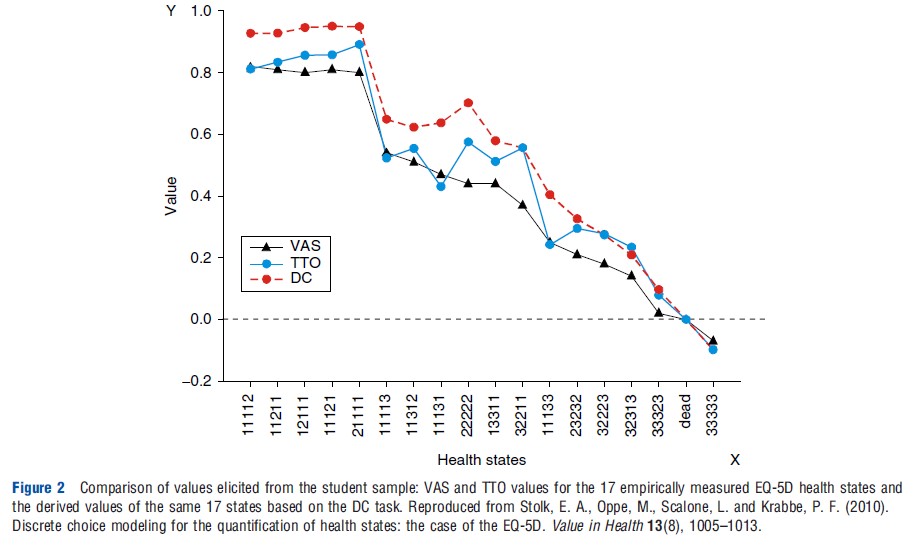
Benjamin Craig and colleagues applied in 2009 a secondary analysis on data for 8 countries collected by the EuroQol Group, which enabled them to compare VAS, TTO, and DC values (derived from rank data). They observed between VAS and TTO coefficients ranging from 0.61 to 0.80 (Kendall’s tau) and ranging from 0.60 to 0.92 for the strength of the relationship between VAS and DC. In a recent study published in 2010, Stolk et al. (2010) observed a convergent validity of 0.93 (ICC; intraclass correlation coefficient) between TTO and values derived under a DC model. Responses in this study were collected from 209 students (Figure 2). Another study from the Netherlands by Denise Bijlenga and colleagues in 2009, based on participation of 97 community persons, found convergent validity of 0.72 (ICC) between VAS and TTO. For the comparisons DC between TTO and VAS they transformed the values of these two methods into binary scores (to create data comparable to raw DC input data, e.g., preference data). Coefficients were 0.79 between VAS and DC (Cohen’s kappa) and between TTO and DC 0.77 (Cohen’s kappa). In an explorative study, Joshua Salomon performed in 2003 a secondary analysis on the original the Measurement and Valuation of Health, University of York, 1995 data that were used to construct the EuroQol-5D valuation function. Transforming this data into rank data followed by DC modeling, a very high similarity between the original TTO data and the DC-derived values was reached: 0.97 (ICC).
Reliability
Reliability deals with the stability of measurements, all other things being equal, and with the congruence between raters in the case of the assessment of stimuli (e.g., health states). To a large extent, achieving reliability is a technical matter (e.g., larger samples sizes, repeated measurements, and increasing number of health states). Two distinct types of reliability coefficients can be distinguished in the field of health state valuation: test–retest and interrater. Test–retest reliability is dealing with the reproducibility of a method. If a method is reliable, it should evoke the same outcomes on a second occasion if there is no alteration due to change expected. The most appropriate way of testing this is by computing the ICC between the test and retest. The interrater (or interobserver) reliability seems less suitable for valuation methods, as here assessment is focused on the scaling of health states. Hence, health states that are related to each other with an underlying natural ordering on a unidimensional scale yields another type of data. However, from a more fundamental measurement perspective the interrater reliability can be used as an indicator for the fulfillment of basic measurement requirement in general. In the following, various data on the reliability of individual responses are reported. The reliability of mean responses in groups of people can be much greater, depending on the size of the group, because random variations in individual responses go both ways and tend to cancel each other out.
Test–Retest
In 1976, George Torrance reported in one of the earliest studies involving both SG and TTO a test–retest reliability coefficient (Pearson correlation based on replications) of 0.77 for both SG and TTO. Test–retest was also studied by Donald Patrick and colleagues in 1973 for the rating scale (numbers from 1 to 11) and produced in a group of health leaders a coefficient of 0.79 (Pearson correlation).
There is little evidence for the test–retest reliability of ME and PTO techniques. Of these two techniques, ME would appear to be most promising in terms of reliability. Rosser and Kind reported test–retest reliability for ME at 97% (percentage of agreement). But it is not clear from their publication whether this is done for the real ME tasks or only for the preceding ranking task. In one of the earliest valuation studies, Patrick and his colleagues applied ME for which they presented a test–retest reliability of 0.74.
In 1995, Erik Nord reported relatively poor test–retest findings for the PTO at the individual level, 40% measured by the percentage of agreement, but stressed that group-level reliability could, nevertheless, be satisfactory. In 1997, Christopher Murray and Arnab Acharya reported a lowest correlation coefficient of 0.87 among 9 different groups that performed the same PTO task. Of course, this statistic is only an approximation for the test–retest as not the same individuals were applied.
The classical method of Thurstone scaling (or paired comparison) has been studied in the area of quantifying health states by Paul Kind and David Hadorn in the early days of health-state valuation. Kind applied the classical Thurstone model and an extension of it, the Bradley–Terry–Luce model, in 1982. However, neither reliability statistics nor comparisons (validity) with other methods were performed. Hadorn and colleagues performed in 1992, a Thurstone scaling analysis, but based on an incomplete and selective design of 54 (59%) of the total number of pairs. In addition, this response mode and analytical steps seem a bit different than the standard approach. Nevertheless, they reported test–retest correlation of 0.79 for Thurstone scaling as well as for the rating scale.
Denise Bijlenga and colleagues also explored a DC model in their 2009 study; the researchers found test–retest results of 0.77 for the VAS (ICC), 0.70 for TTO (ICC), and 0.78 (Cohens’s kappa) for DC values.
Interrater
Item Response Theory models, and in particular the Rasch model, are built to deal with ‘objective’ measurement of subjective phenomena. The most important claim of the Rasch model is that due to the mode of collecting response data in combination with the conditional estimation procedure of the model, the derived measures may fulfill the invariance principle. This is a critical criterion for fundamental measurement. Invariance means that the comparison between two (or more) health states should be independent of the group of respondents that performed the comparisons, and judgments among health states should also be independent of the set of health states being compared.
This invariance principle is closely related to an (implicit) assumption made in the field of health state valuation, namely, that in general people evaluate health states similarly, which permits the aggregation of individual valuations to arrive at group or societal values. The invariance principle seems also related to the IIA assumption (independent of irrelevant alternatives) made in DC models. Therefore, it is important to determine how similar people’s judgments actually are for particular valuation techniques, as heterogonous responses (or even distinct response structures) of individuals may indicate that a valuation technique is less appropriate as it may not yield unidimensional responses. Such an analysis can be performed with intraclass correlation statistics (interrater reliability) or specific mathematical routines closely related to factor analysis.
For these reasons, the author wants to assess, additional to test–retest reliability, the consistency across subjects in their task of rating health states (i.e., group level). This type of reliability is indicated as interrater reliability. To compute this reliability coefficient for all health states together, based on a variant of analysis of variance, a global interrater coefficient can be estimated. Formally, this coefficient is a simple adaptation of the conventional Cronbach’s alpha (internal consistency measure); instead of multiple items, multiple raters are now being investigated. Although the interrater reliability is formally a statistic that expresses the homogeneity of the responses among raters, this statistic may also be seen as evidence for the content validity. Because a high interrater coefficient may only be expected if most of the raters have a rather similar understanding of the valuation task and in addition come up with comparable preference scores for the valued health states.
By the use of Generalizability Theory, a specific application of analysis of variance, Krabbe et al. (1997) were able to reveal various sources of measurement error in the elicited values for health outcomes. Although all the methods to some extent seem to be biased, the valuation methods yield health state valuations that were satisfactorily reliable at the group level: SG 0.58, TTO 0.65, and VAS 0.77. These findings support the validity of constructing societal values for health states based on aggregated data. In an earlier postal survey, which was also conducted using EuroQol health-state scenarios, VAS interrater reliability coefficients in the range 0.77–0.84 were observed by Marie-Louise Essink-Bot and colleagues in 1993. Both results confirm the relatively good properties of VASs with regard to the interrater reliability of the responses. It should be noted that Leighton Read and colleagues in their 1994 study also applied a type of analysis of variance analysis that approximates the G-theory approach. They also found that the variability of responses among respondents is considerably greater for SG than for VAS. Denise Bijlenga and colleagues estimated interrater ICCs for the VAS (0.73), TTO (0.33), and the DC (0.64).
The independency of the set of health states (invariance principle) to be positioned on the VAS has been rejected in two Dutch studies by Han Bleichrodt and Magnus Johannesson in 1997 and Paul Krabbe and colleagues in 2006. Both studies clearly showed that different values will be collected with a multiitem VAS for a fixed set of health states if these are part of varying other states. It is reasonable to assume that these biases may even be larger in the case of measuring health states on a VAS state by state.
Responsiveness
The concept of responsiveness (or sensitivity) has arisen over the past 20 years and refers to the ability of an outcome measure to reflect change. To be of value, an instrument should be stable when no change occurs, although reveal differences in case of improvement or deterioration of a person’s health status. The concept of responsiveness has drawn considerable attention among the users of descriptive HRQoL instruments (questionnaires). Most of these users are working in the field of medicine, where responsiveness is part of the clinical framework of health measurement, called ‘clinimetrics.’ This term was coined to describe an approach to scale development in the area of health that is ostensibly different from the more traditional approach known as ‘psychometrics.’ These two approaches differ from both in a conceptual and a methodological viewpoint.
Many within the field of descriptive HRQoL or patientreported outcomes research agree that responsiveness is important, yet there is no consensus on how to quantify it. The confusion even extends to the conceptualization, study design, and measurement of responsiveness. Conspicuously absent is a theory on its relationship to the two classic psychometric concepts, reliability and validity. Responsiveness seems to have a bearing on validity because an instrument first has to measure what it was designed to measure in order to measure accurately. Responsiveness also seems to have a bearing on reliability; if an instrument is unreliable it will not be responsive to changes. Formal research fields in the social sciences (e.g., psychometrics, mathematical psychology, and measurement theory) offer no empirical, theoretical, or mathematical support for the notion of responsiveness. Nevertheless, responsiveness is used here as a theoretical construct that can only be examined by means of comparison with other measurement instruments and practical experiences.
So far, it seems that the responsiveness has not been investigated for preference-based instruments. This is to some extent explainable as most often valuation techniques are used to quantify certain health states or conditions. They are far less applied to measuring changes between two measurement occasions (in the case of estimating the test–retest property, everything is done to reduce possible changes in the health status of individual). Accordingly, for the applications of the valuation methods there are arguments why this has not been done. Of course, for the use of the so-called preference-based multiattribute systems, such as the EuroQol-5D (EQ-5D), the Health Utility Index Mark III, and the Short-Form 6D it is more informative and more important to have results about the responsiveness of these systems.
Level Of Measurement
Apart from theoretical and methodological differences between the valuation techniques, the general underlying assumption is that individuals possess implicit preference for health states that range from good to bad and that, in principle, it should be possible to reveal these preference and express them as quantitative or semiquantitative values. The implication of this is that the values should be characterized as interval level data or cardinal data. So, differences between health states should reflect the increment of difference in severity of these states. For that reason, informative (i.e., metric) outcome measures should be at least at the interval level. This means that measures should lie on a continuous scale, whereby the differences between values reflect true differences (i.e., if a patient’s score increases from 40 to 60, this increase is the same as from 70 to 90).
Although there have been interest from the onset of quantifying health states in the classical psychometric reliability statistics (validity remains a difficult factor in this area of subjective measurement), far less attention have been directed on the basics of measurement theory in general. Unfortunately, it seems that certain crucial conditions of measurement are hardly recognized by scientists working in the field of quantifying health states. In particular, to arrive at health state values that are characterized as having cardinal or interval level measurement properties, certain basic conditions are required. This involves the invariance principle in collecting response data, but another requirement is unidimensionality of the measurement scale.
Economists tend to claim that responses to the TTO and the SG have interval scale properties, whereas responses to rating scales, including the VAS, tend not to have interval scale properties, given that in the latter, no trade-offs are expressed.
Around 1990, Erik Nord and Jennifer Morris/Allison Durand published two papers showing that when subjects locate a set of health states on a straight value line ranging from 0 to 100, most subjects do not intend to express more than ordinal preference. In a later attempt to find empirical evidence to support that mean health state values collected with a (multiitem) VAS can be characterized roughly as interval data, based on a rank-based scaling model (unfolding), Heleen van Agt and colleagues observed in 1994 a very strong relationship that support the interval property of the raw VAS data. Confirming results were found in a study by Paul Krabbe and colleagues in 2007 that applied nonmetric multidimensional scaling on data (metric and ranks) that were derived from VAS values. Parkin and Devlin (2006) argued that there is no more evidence for interval scale properties in TTO responses and SG responses than in VAS responses.
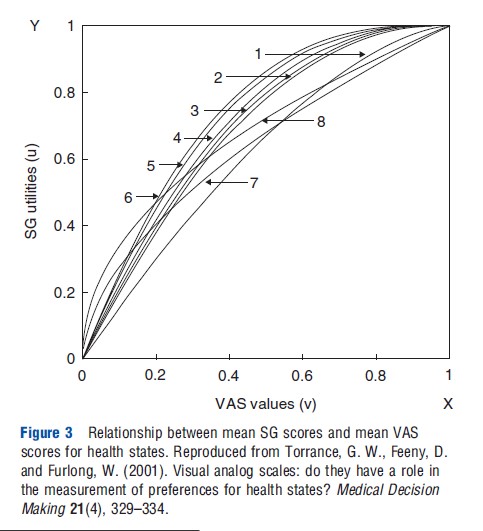
In a paper by George Torrance and colleagues in 2001, results are presented of a more detailed analysis between the relationship of SG and the VAS. Based on their own study outcomes and incorporating studies from other published studies (all aggregated group means), they show that there is a clear concave curve that passes through 0 and 1 (Figure 3). Similar results were also found for the relationship between TTO and VAS. In fact, if the relationship between two different valuation techniques is nonlinear, this implies that at least one of these two methods cannot be regarded as a true metric scale (cardinal or interval differences between the mean values of the health states).
Based on the results of one of the earliest studies to derive health state values based on DC modeling, Salomon concludes that predicted health state valuations derived from a model of ordinal ranking data can provide a close match to observed differences between cardinal values for different states. The model may be used to generate robust predictions on an interval scale, with predictive validity rivaling that of a model estimated directly from TTO values.
To find empirical evidence to support that health state values are overly representing a unidimensional structure, Paul Krabbe in 2006 used a basic mathematical routine to dissect valuation data into underlying dimensions. This study revealed deviating response behavior among the respondents in their health state valuation elicited with the TTO, whereas a similar analysis on VAS data showed a single dimension. A logical explanation for the absence of unidimensionality of the TTO is that this method is measuring two distinct phenomena (health states and longevity) simultaneously.
Conclusion
It is not surprising that the results found by the author are heterogeneous. Most studies about comparing different valuation techniques were conducted years ago. Certainly in the beginning, most studies were relatively small, often clinically oriented, and there was less harmony about the way valuation methods should be performed. Moreover, in each valuation technique the subjects are faced with a cognitive task that differs from that used with other techniques. In addition, several of the techniques exist in different versions that frame the decisions in different ways. In general, studies focused on comparing different valuation techniques can be differentiated in terms of the type of descriptions of the health states, selection of study population, number of health states, and types of health states. Health states can be divided into hypothetical states and actual or hypothetical health states pertaining to treatment outcomes or particular stages of disease.
Conventionally, the values for different health states used in economic evaluations are derived from a representative community sample. Subjects who value the hypothetical health states need not be familiar with specific illnesses. However, it is reasonable to assume that in many situations healthy people may be inadequately informed or lack good imagination to make an appropriate judgment about the impact of (severe) health states. Many authors assert that individuals are the best judges of their own health status instead of unaffected members of the general population. Numerous studies have found discrepancies in valuations for health states between the general population (healthy people) and people who actually experience illness (patients). Several of these discrepancies can be explained by referring to adaptation mechanism made by patients, but for the frequently applied TTO, it is above all the central element time that likely induce different values for different respondents.
References:
- Krabbe, P. F. M., Essink-Bot, M. L. and Bonsel, G. J. (1997). The comparability and reliability of five health-state valuation methods. Social Science & Medicine 45, 1641–1652.
- Parkin, D. and Devlin, N. (2006). Is there a case for using visual analogue scale valuations in cost-utility analysis? Health Economics 15, 563–564.
- Stolk, E. A., Oppe, M., Scalone, L. and Krabbe, P. F. (2010). Discrete choice modeling for the quantification of health states: The case of the EQ-5D. Value in Health 13, 1005–1013.
- Brazier, J. E., Ratcliffe, J., Salomon, J. and Tsuchiya, A. (2007). Measuring and valuing health benefits for economic evaluation. Oxford: Oxford University.
- Froberg, D. G. and Kane, R. L. (1989). Methodology for measuring health-state preference – II: Scaling methods. Journal of Clinical Epidemiology 42, 459–471.
- Kind, P. (1982). A comparison of two models for scaling health indicators. International Journal of Epidemiology 11, 271–275.
- Nord, E. (1992). Methods for quality adjustment of health states. Social Science & Medicine 34, 559–569.
- Richardson, J. (1994). Cost-utility analysis: What should be measured? Social Science & Medicine 39, 7–21.
- Streiner, D. L. and Norman, G. R. (2008). Health measurement scales: A practical guide to their development and use. Oxford: Oxford University Press.
- Tengs, T. O. and Wallace, A. (2000). One thousand health-related quality-of-life estimates. Medical Care 38, 583–637.
- Torrance, G. W. (1986). Measurement of health state utilities for economic appraisal. Journal of Health Economics 5, 1–30.