The disability-adjusted life year (DALY) is a summary measure of population health that accounts for both mortality and nonfatal health consequences. DALYs were first developed for the primary purpose of quantifying the global burden of disease (GBD). In this context, the DALY was designed as the unit of analysis for measuring the relative magnitude of losses of healthy life associated with different causes of disease and injury. In addition to measurement of the burden of disease, another intended use for DALYs was as a metric for health benefits in the denominator of cost-effectiveness ratios. This article introduces the conceptual and computational basis for DALYs and discusses key issues relating to value choices underlying DALYs, with a brief discussion of how DALYs relate to quality-adjusted life-years (QALYs).
Basic Concepts
A DALY is equivalent to one lost year of healthy life. DALYs accumulate when individuals die prematurely or when they live with the health consequences of diseases, injuries, or risk factors. For a particular cause of disease or injury, DALYs are computed as the sum of (1) ‘years of life lost’ (YLLs), which capture premature mortality and (2) health losses in ‘years lived with disability’ (YLDs), which capture lost healthy life due to living in states worse than perfect health. The following sections elaborate on these two components.
Years Of Life Lost
YLLs are measures of health losses due to premature mortality. Calculation of YLLs requires some quantification of how long people ‘should’ live, that is, a normative target lifespan by which the length of life lost due to each death at a certain age may be evaluated. For example, the normative target might imply that a person who is aged 60 years should expect to live another 10 years, that is, until the age of 70 years. In that case, 100 deaths among people at the age of 60 years translates to 100 × 10 =1000 YLLs. There are various possible ways to define a normative target lifespan, as described by Christopher Murray in his 1996 essay entitled ‘Rethinking DALYs.’ Some norms imply a target lifespan that is constant across ages at death, whereas others imply a target lifespan that shifts depending on the age that has been attained. The latter are typically based on life tables that give expectations of life at different ages. In the GBD study, a global standard life table has been used based on an egalitarian argument for valuing a death at a particular age as the same loss irrespective of where the person lived. Another choice that is made is whether the same life table is used for males and females. In the GBD for the year 1990 and revisions through 2008, two different life tables were used, with the standard for females based on a life expectancy at birth that was 2.5 years greater than the life expectancy at birth in the standard for males. The argument for the different standards was based on a plausible biological difference in longevity. In the revision of the GBD for the year 2010 (hereafter ‘GBD 2010’), a new standard was used, based on a synthetic life table constructed from the lowest currently observed mortality rates at each age. The other change in the GBD 2010 was that a single standard life table was defined for both males and females.
Years Lived With Disability
YLDs may be understood conceptually as partial losses of healthy years due to living in health states that are worse than optimal health, weighted for the severity of the states. For example, 10 years lived in a health state that constitutes a 50% reduction in health, i.e., a state that resides halfway between death and perfect health, would imply a total of 10×0.5 = 5 YLDs. Construction of YLDs requires a defined measurement construct for health losses, a way to quantify these losses, and an approach to attribute losses to years of life lived with a particular condition.
Cases And Sequelae
The GBD maps losses of health due to disease and injury through the concepts of cases and sequelae. For cases of a given disease or injury in the population, the experience of health until remission or death will include an array of different health states. For the sake of parsimony, burden of disease calculations require that this multitude of health states be approximated by a small number of discrete entities characterized under the umbrella term of sequela. The sequela is the unit of analysis for epidemiological estimates and YLD calculations. In the GBD, health states are defined by levels of functioning within a set of health domains, for example, mobility, pain, vision, or cognition. These health states are not defined in References: to general well-being or ‘quality of life’ (both broader constructs). Nor do the health states refer to aspects of participation in society, although different levels of functioning in domains of health may clearly affect – and be affected by – these other aspects.
Incidence And Prevalence
YLDs may be computed based on either an incidence or a prevalence perspective. In an incidence perspective, the YLDs associated with a particular sequela are computed in terms of the number of incident cases of the sequela, times the average duration of time spent in the sequela, times a disability weight reflecting the magnitude of health loss experienced for each unit of time lived with the sequela. (Disability weights are discussed further in the next section.) For example, if there were 100 new cases of blindness in a population, and each case of blindness had an average duration of 20 years and an average disability weight of 0.25, then the YLDs due to blindness computed from an incidence perspective would be 100×20×0.25 = 500. From a prevalence perspective, the calculation is simply the prevalence of a sequela at a defined point in time (e.g., the midpoint in the year of interest), multiplied by the disability weight. For example, if in a population there were 1000 people living with asthma this year, and asthma had a disability weight of 0.10, then the YLDs due to asthma computed from a prevalence perspective would be 1000 0.10 ¼100.
Disability Weights
Disability weights provide the bridge between information on mortality and information on nonfatal outcomes in DALYs. These weights represent cardinal measures of health decrements on a scale ranging from 0 (signifying conditions that are equivalent to ideal health) to 1 (signifying conditions that are equivalent to being dead). Thus, for example, if a year lived with deafness has a disability weight of 0.25, this implies that 4 years lived in deafness would be an equivalent health loss to dying 1 year ‘too early’ in References: to some defined target for longevity (i.e., 4×0.25 =1).
Disability weights are needed for every sequela that is included in the study. For most sequelae, a single disability weight is applied to time spent in that sequela under the simplifying assumption of an approximately constant, homogeneous health experience for those living with the sequela over its specified, average duration (taking an incidence perspective). Within this framework it is important to recognize that an individual may have more than one disabling sequela at the same time. The disability weight refers to the average health loss for individuals with a particular condition in the absence of other comorbidities. Without adjustment for comorbidities, the implicit assumption is that multiple sequelae in the same person combine additively, which may not accurately describe the real effects of comorbidity on functional health. Some researchers have suggested various alternative approaches to account for the presence of multiple sequelae, other than assuming additivity.
Assignment of disability weights to the range of sequelae in the first iteration of the GBD 1990, undertaken during the early 1990s, was based on first defining six different disability classes, and then mapping from each sequela into the class or classes that applied to incident cases of that sequela. The six disability classes were defined in References: to limitations in activities of daily living such as eating and personal hygiene; instrumental activities of daily living such as meal preparation; and four other domains (procreation, occupation, education, and recreation). Weights were assigned to the different classes by a panel of public health experts using a rating scale approach. Once the weights attached to each of the six classes were determined (by averaging the values from the expert panel), the disability weight for a particular sequela was estimated by (1) specifying a distribution of incident cases across the different classes – reflecting either the proportion of time an average incident case would spend in different disability classes, or the proportion of incident cases that would be characterized by different severity levels and (2) computing the average weight across this distribution.
For the revision of the GBD 1990 that was completed in 1996, a new approach to estimating disability weights was devised based on two variants of the person trade-off (PTO) method. The revision of the approach was inspired by some specific criticisms of the original approach: (1) that the disability classes were appropriate only for adults (because, e.g., children were naturally dependent on adults for some of the referenced activities); (2) that no formal, replicable protocol was available to guide those aspiring to undertake a national burden of disease exercise; (3) that the class with the lowest level of disability was valued at 0.096, which produced a scale that was too blunt to capture very mild conditions; and (4) that the valuation task itself did not allow the expert panelists to reflect on the policy implications of their values.
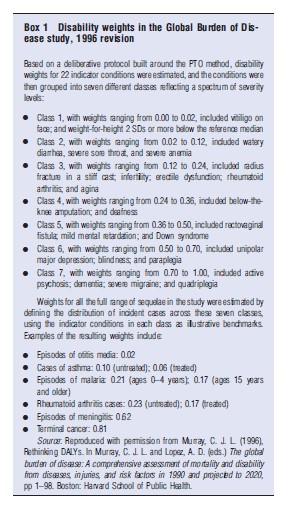
New disability weights in the 1996 exercise were elicited from a panel of health professionals following an explicit protocol. In the protocol, a series of 22 indicator conditions were evaluated through an intensive group exercise involving two variants of the PTO and incorporating a deliberative process to encourage reflection on the values that emerged during the exercise. The first type of PTO question asked participants to trade off life extension in a population of healthy individuals versus life extension in a population of individuals having a particular condition. The second type of PTO question asked participants to trade off life extension for healthy individuals versus health improvements in individuals with the References: condition. Participants were required to resolve inconsistencies in the numerical weights implied by the two alternative framings of the PTO. The final consistent values implied by the reconciled PTO responses, averaged across participants, defined the disability weights for the 22 indicator conditions, which were then clustered into seven different classes of severity. As each class contained several of the indicator conditions, these indicators thereby supplied an intuitive and easy-to-convey operational definition of the severity of each class (see Box 1).
To generate disability weights for the remainder of the disabling sequelae in the study, participants were asked to estimate distributions across the seven classes for each sequela. In this second stage, the indicator conditions in each class were used as ‘pegs’ on the scale from perfect health to conditions equivalent to being dead to guide estimation of the distribution across the seven classes of disability. As described above for the first iteration of GBD 1990, the distributions across classes were intended to reflect either the proportion of time a typical case for a given sequela would spend in each class or the percentage of cases that would be categorized in each of the different classes. Distributions across disability classes were estimated separately for treated and untreated cases where relevant, and weights could also vary by age group. The box below presents a few examples of disability weights for common causes.
Various critiques have challenged aspects of the 1996 disability weight measurement exercise. For instance, several critics have questioned the use of healthcare professionals as respondents and suggested that there might be cross-cultural variation in disability weights that should be evaluated. In 1999, Trude Arnesen and Erik Nord argued that there was a serious ethical problem with the first variant of the PTO question used and a logical problem with the requirement that there should be numerical consistency between responses to the two different variants, given that these addressed two different issues. These critiques notwithstanding, the disability weights used for updates of the GBD undertaken through2008 were still largely based on the GBD disability weights as measured in the 1996 exercise. For certain conditions, where weights were not available from the original GBD Study, provisional weights were used from the Dutch Disability Weights study or from the Australian Burden of Disease study. The Dutch Disability Weights study used a similar protocol to the GBD 1996 revision, with the addition of health state distributions for sequelae described in terms of a variant of the EQ-5D classification system.
More recently, prompted by a more general research agenda on developing internationally comparable summary measures of population health at the World Health Organization, the use of the PTO as the basis for disability weights in DALYs has been reconsidered. The most recent thinking on DALYs reflects an effort to more precisely delineate the concept embodied in the nonfatal component of the measure, which has led to the explicit definition of disability weights as measures of overall levels of health associated with health states rather than as measures of the utility associated with these states or the contribution of health to overall welfare. Although some have argued that the burden of disease must be quantified in terms of overall welfare loss because health and well-being are not separable, others have challenged this view, and this debate goes on. In the GBD 2010, a large empirical exercise to measure disability weights has been conducted using household surveys in five countries and an open-access internet survey. This study uses a much simpler method for eliciting weights, based on simple paired comparisons of sequelae described with brief labels. A number of the new weights are lower than the previous ones, including weights on sensory impairments, infertility, and intellectual disability. Other weights are higher in the new study, including weights for some states relating to epilepsy, illicit drug use disorders, and low-back pain. Another significant finding in the new study is that responses to comparisons of health states are remarkably consistent across the diverse sampled populations, which contradicts the prevailing hypothesis that assessments of disability must vary widely across cultures.
Other Value Choices Relevant To Both Years Of Life Lost And Years Lived With Disability
Discounting
Many of the arguments around discounting invoked in the context of QALY measures have also been rehearsed in the discussion of DALYs as population health measures. Until recently, the use of an annual discount rate of 3% has been the default standard in the construction of the DALY, as in the recommended base case analysis for cost-effectiveness studies; in both cases it is typically advised that alternatives should be considered in sensitivity analyses. For the GBD 2010, a simpler variant of DALYs has been adopted for the base case, with no discounting.
Age Weights
In addition to discounting, some have argued for assigning unequal weights to life years lived at different ages, and the standard DALY prior to the GBD 2010 included weights that give the highest values to years lived in young adulthood. A range of arguments have been considered in relation to age weighting, with References: to empirical findings on weights that people attach to years over the life course and to important ethical considerations. The developers of the DALY measure previously argued for unequal age weighting based on the social roles played at different ages, but age weights remain controversial. For the GBD 2010, the base case DALYs are not differentially weighted by age.
Applications
DALYs have been used for both quantifying the burden of disease and as the unit of effectiveness in the denominator of cost-effectiveness ratios for economic evaluation of health interventions and programs. The major debut of the DALY in the World Bank’s World Development Report 1993 introduced applications of the measure toward both ends. Various revisions of the GBD have continued to use DALYs as the main unit of account for assessing the relative magnitude of health losses associated with various diseases, injuries, and risk factors, with the latest revision (GBD 2010) introducing some changes in the specific value choices reflected in the construction of DALYs for base-case analyses, as described above. For use in cost-effectiveness analyses, guidelines from the World Health Organization on conducting ‘generalized cost-effectiveness analyses’ – with a particular focus on health policies in developing countries – have included an explicit recommendation to use DALYs as the measure of benefit in these analyses.
DALYs And QALYs
DALYs are closely related in concept to QALYs. Both are metrics that take healthy time as the unit of account. Both attach weights to the continuum of health outcomes residing between optimal health and death. An important distinction is in the intended uses of the two metrics. As noted above, DALYs are used both as summary health measures for purposes of descriptive epidemiology, i.e., as units for measuring burden of disease, and as measures of the health benefits of interventions, for example, in cost-effectiveness analyses. QALYs are used primarily for the latter purpose, but there have been assessments of a related measure called ‘quality-adjusted life expectancy’ as a measure of the overall average level of health in a population. The construction of summary measures of population health has much in common with the construction of measures of the benefits from health interventions, so the distinction is unimportant when considering many of the features of the measures.
Christopher Murray and Arnab Acharya, in their 1997 essay on DALYs, characterized the relationship between DALYs and QALYs as follows: ‘‘DALYs can be considered as a variant of QALYs which have been standardized for comparative use.’’ There are certain key distinctions worth noting.
As DALYs are negative measures that reflect health losses, the scale used to quantify nonfatal health outcomes in DALYs is inverted compared with the scale used in QALYs; that is, numbers near 0 represent relatively good health levels (or small losses) in DALYs, whereas numbers near 1 represent relatively poor health levels (or large losses). The inverted scale means that interventions that improve health result in DALYs averted, whereas QALYs are gained.
Disability weights in DALYs, which are the health state valuations analogous to the ‘quality’ adjustments in QALYs, are intended to reflect the degree to which health is reduced by the presence of different conditions, whereas at least one interpretation of the weights in QALYs is based on the individual utility derived from different states. The current interpretation of weights in DALYs reflects some evolution over time, as discussed above. Another distinction relating to disability weights is that in the GBD disability weights are assigned to health states that are attached explicitly to the sequelae of specific diseases and injuries, whereas in many applications of QALYs health states are described in terms of concrete symptoms and functional losses, without References: to specific conditions.
The standard formulation of DALYs used in revisions through 2008 has weighted healthy life lived at different ages according to a variable function that peaks at young adult ages, whereas QALYs do not typically incorporate unequal age weights. As noted above, the GBD 2010 revision has moved to using DALYs without age weights.
For measuring the burden of disease, YLLs due to premature mortality at different ages are computed with References: to a standard life table. For purposes of cost-effectiveness, this distinction is largely inconsequential, because the standard life expectancy largely nets out when benefits of interventions are computed as the change in DALYs. As a simplified example, imagine an intervention that defers one death from the age of 50 years to the age of 70 years, and suppose that the normative target lifespan used as the yardstick for DALYs is 80 years (irrespective of one’s current age). Then the number of DALYs averted through intervention is a change from 80- 50 = 30 to 80-70 =10, for a net of 20 DALYs averted, which is the same as the number of QALYs gained through the intervention. (Note that in the actual standard life table that is used, as in most life tables, the target lifespan, equal to the number of years of remaining life expectancy at age x plus x, rises slightly with advancing adult ages rather than remaining constant as per the simple example here. This will produce a slight discrepancy between DALYs averted and QALYs gained, but this difference is usually negligible.)
References:
- Anand, S. and Hanson, K. (1997). Disability-adjusted life years: A critical review. Journal of Health Economics 16(6), 685–702.
- Arnesen, T. and Nord, E. (1999). The value of DALY life problems with ethics and validity of disability adjusted life years. British Medical Journal 319(7222), 1423–1425.
- Hausman, D. M. (2012). Health, well-being, and measuring the burden of disease. Population Health Metrics 10(1), article 13.
- Murray, C. J. L. (1994). Quantifying the burden of disease: The technical basis for disability-adjusted life years. Bulletin of the World Health Organization 72(3), 429–445.
- Murray, C. J. L. (1996). Rethinking DALYs. In Murray, C. J. L. and Lopez, A. D. (eds.) The global burden of disease: A comprehensive assessment of mortality and disability from diseases, injuries, and risk factors in 1990 and projected to 2020, pp 1–98. Boston: Harvard School of Public Health.
- Murray, C. J. L. and Acharya, A. K. (1997). Understanding DALYs. Journal of Health Economics 16(6), 703–730.
- Murray, C. J. L., Ezzati, M., Flaxman, A. D., et al. (2012). Comprehensive systematic analysis of global epidemiology: definitions, methods, simplification of DALYs, and comparative results from the global burden of disease 2010 study. Lancet 380(9859), pp 2055–2058.
- Nord, E., Menzel, P. and Richardson, J. (2006). Multi-method approach to valuing health states: Problems with meaning. Health Economics 15(2), 215–218.
- Salomon, J. A. and Murray, C. J. L. (2004). A multi-method approach to measuring health-state valuations. Health Economics 13(3), 281–290.
- Salomon, J. A., Vos, T., Hogan, D., et al. (2012). Common values in assessing health outcomes from disease and injury: Disability weights measurement study for the Global Burden of Disease Study 2010. Lancet 380(9859), pp 2129–2143.