Cost–value analysis (CVA) is a type of formal economic evaluation that can be used to inform decision makers in a public health service about the value to the public of different health technologies and what ought to be the public health service’s maximum willingness to pay for them. In estimating value and limits to willingness to pay, CVA takes into account that in most countries with a public health service, citizens and societal decision makers hold concerns for both efficiency and equity. The concern for efficiency means that value – and thus willingness to pay – increases with the size of the health benefit provided by the technology – measured, for instance, in terms of the number of quality-adjusted life-years (QALYs) produced. Equity concerns may, for instance, mean that for a given health benefit, value and willingness to pay increase with the severity of the condition that is addressed. Other equity concerns may also be relevant (see History and Value Basis).
CVA has features in common with cost–utility analysis. Costs are estimated in the same way, and health benefits are expressed in QALYs. The difference is that concerns for equity are included in the determination of value. The replacement of the term ‘utility’ with the term ‘value’ in the name of the analysis serves to emphasize this difference. Whereas ‘utility’ refers to individuals’ personal valuations, ‘value’ in ‘cost–value analysis’ refers to a broader societal concept. The basic premise of CVA is that simple aggregations of QALYs do not yield reliable estimates of citizen’s overall valuation of different programs, because concerns for equity are not included in such simple aggregations.
Example
In CVA, the value of a program can either be expressed in equity-weighted QALYs (EQALYs) or in a public health care service’s willingness to pay for QALY gains, given the context in which the gains occur and the characteristics of the patients who receive them. A simple example is as follows: Assume a scale of individual utility of health states from 0 to 1. Assume that intervention ‘A’ takes one type of patient from utility level 0.4 to level 0.6 for 1 year at a cost of EUR 10 000, whereas intervention ‘B’ takes another type of patient from level 0.8 to level 1.0 for 1 year at the same cost. The two interventions are equally cost effective (because the QALY gain and the cost is the same). But the societal appreciation (value) of the 0.2 QALYs in intervention A may be, say three times as high as that in intervention B, given the much greater severity of the preintervention condition in A and thus the much greater need in this type of patient. The cost–value ratio of intervention A would then be better than that of intervention B, namely 10 000/(0.2×3) = €16 700 EUR per EQALY versus 10 000/0.2 = €50 000 EUR per EQALY, which suggests that A should be given priority among the two if a choice had to be made. To put it differently, it suggests that, in a society where such a concern for severity prevails, the public health care system should have a three times higher willingness to pay for intervention A than for intervention B, in spite of B producing the same amount of QALYs. CVA thus supports context dependent, graded willingness to pay for QALYs.
History And Value Basis
The term ‘cost–value analysis’ was first introduced by Nord in 1993. It may be used in a general sense, that is, about any evaluation that takes into account relevant concerns for fairness (equity) in the weighting of individual benefits, whatever these concerns may be. However, in the development of CVA hitherto, some concerns have been treated as particularly salient. Based on a review in 1999 of existing materials in Australia, the Netherlands, New Zealand, Norway, Spain, Sweden, the UK, and the USA, Nord suggested that ethicists’ and policy makers’ reflections, and results from public preferences measurements, seem to converge on the following points:
- Society demands that medical interventions satisfy a minimum requirement of effectiveness for resource use to be justified.
- Society’s appreciation (valuation) of medical interventions increases strongly with increasing severity of the patients’ condition. (This is often referred to as a ‘concern for the worse off.’)
- Life saving or life extending procedures are particularly highly valued, and significantly more highly than interventions even for patients with severe chronic conditions.
- When the minimum requirement of effectiveness is satisfied (see point A), society worries less about differences in the size of the health benefits provided by treatment programs for different patient groups, the underlying attitude being that people are entitled to realizing their potential for health, whether that be large or moderate, given the state-of-art in different areas of medicine.
- As a special case of point D, society in most cases does not wish to discriminate between people with different potentials for health in decisions about life saving or life extension. For instance, society regards the prevention of premature death in people with chronic disease as equally worthy of funding as the prevention of premature death in otherwise healthy people. (Life extending interventions for people in vegetative states or states of very low subjectively perceived quality of life is an exception from this rule.)
Work on CVA hitherto has aimed at incorporating the specific ethical concerns above in formal valuation models (Nord et al., 1999; Nord, 2001). The term ‘cost–value analysis’ is thus mostly used in this specific operational meaning rather than in the more general sense noted earlier.
Preferences Measurements
To incorporate the above concerns in a numerical valuation model, data are needed on the strength of preferences for equity. The strength of societal concerns for severity and realization of potentials has been studied in samples of the general public in several ways. The most widely used technique is the person trade-off, which was introduced by Patrick, Bush, and Chen in 1973 under the name ‘equivalence of numbers’ and was given its present name by Nord in 1995. Typically, samples of the general public are presented with pairs of programs targeting two groups of patients that differ on one characteristic. The subjects are presented with numbers of beneficiaries in the two programs and asked to judge at what ratio between the numbers of beneficiaries they find the two programs equally worthy of funding. For instance, program A provides an improvement in utility from 0.4 to 0.6 for 100 people, whereas program B provides an improvement from 0.8 to 1.0 for a larger number of people. How large must the latter number be for the two programs to be deemed equally worthy of funding? The stronger the concern for the worse off (those in program A), the higher will the stated ‘equivalence number’ in program B be.
Person trade-off responses that take into account special concerns for severity may be represented by values for health states on the 0–1 scale from dead to full health used for QALYs. For instance, a program A prevents death in 10 people and allows them to live in full health. Program B averts an illness that leads to nonfatal state S. Assume that people consider 100 averted cases in program B to be equally worthy of funding as 10 averted deaths in program A. The value of S is then given by 1- (10/100) = 0.9. Person trade-off-based values for health states are typically higher than utilities obtained for the same states by techniques ordinarily used in the QALY field.
Other possible approaches to measuring public preferences for equity include questions about willingness to pay and questions formulated by Paul Dolan about how large a health benefit for one group of patients needs to be relative to a given health benefit for another group of patients for the two benefits to be deemed equally valuable from a societal perspective.
Modeling
Technically, there are various ways of incorporating data about concerns for equity in formal evaluation models. They may all be seen as modifications of the QALY approach that lead to evaluation in terms of EQALYs.
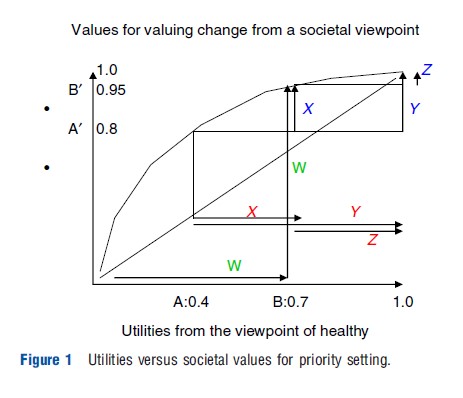
One modification, suggested by Nord et al. in 1999, is to count as one all gained life years, even if they are in less than full health, as long as they are good enough to be desired by the individuals concerned. The purpose of this is to avert discrimination against the chronically ill or disabled in valuations of interventions that extend life (confer (cfr) point E in the section ‘History and value basis’). A second modification proposed by the same researchers is to place less weight than the QALY approach does on the duration of health benefits in comparisons of programs for patients with different life expectancies (cfr point D in the section ‘History and value basis’). This may, for instance, be done by discounting distant health gains more strongly than at the 3–5% annual rate that is customary in conventional cost-effectiveness analysis, or by disregarding benefits that lie beyond a certain point in time. A third modification is to multiply utility gains as estimated by conventional QALY tools with explicit equity weights reflecting the severity of the preintervention condition and the degree to which health potentials are realized (cfr points B–D in the section ’History and value basis’). Alternatively, one may transform conventional utilities into societal values as illustrated in Figure 1. A transformation curve that is convex to the Y-axis and has strong upper end compression can, in principle, accommodate concerns for both severity and realization of potentials. For instance, in the figure the curve transforms conventional utilities of 0.4 and 0.7 to societal values of 0.8 and 0.95. If one replaces utilities from the X-axis with the values from the Y-axis, the value, for instance, of a cure of A relative to B increases from 2:1 to 4:1 (concern for severity), whereas the value, for instance, of taking someone from A to B relative to from A to healthy increases from one-half to three fourth (concern for reduced potential).
Tentative transformation functions of the kind in Figure 1 were published by Nord in 2001 for utilities from various multiattribute utility instruments commonly used in QALY calculations. Table 1 contains the same type of information. Based on meta-analysis of policy documents and public preferences measurements in several countries, the table shows a set of values for health states that purports to reflect the structure of societal concerns for severity and realization of potentials, using limitations in mobility as an example. The table is included as a potentially helpful analytical tool in guidelines for pharmacoeconomic evaluations in Norway.
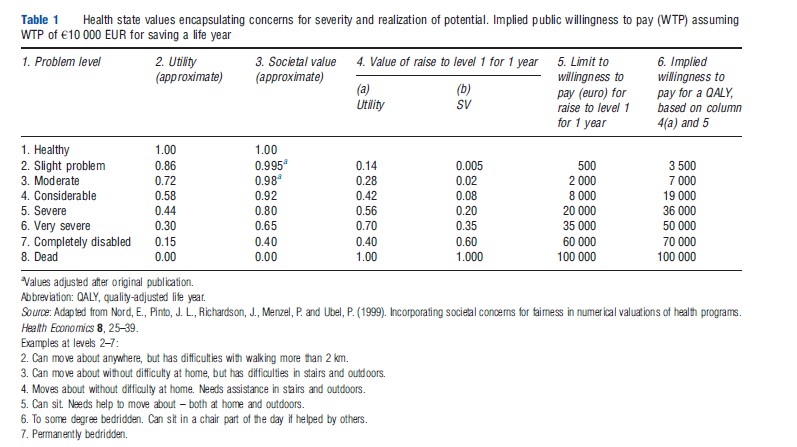
Consider first the columns 1–3 in the table. The examples of states on the 8-level scale in column 1 were chosen with a view to making any one step move upwards on the scale to be roughly of the same importance from the viewpoint of affected individuals. In other words, the scale purports to be an equal interval scale in terms of individual utility. This suggests an even distribution of the 8 levels over the 0–1 utility space, i.e., utility scores for the various levels, roughly as in column 2. The numbers in column 3 are societal values. Concerns for severity are reflected in the fact that movements one step upwards on the scale are assigned more value the lower the start point. Concerns for not discriminating too strongly against groups with reduced potentials for health are reflected in the fact that from any given start point, improvements of different size (i.e., consisting in different numbers of steps on the scale) do not differ as much in value as they do in terms of individual utility gains calculated from column 2.
Health state values with a pattern as that in column 3 may be used to weight life years and improvements in health status in the same way as is done in QALY calculations. But valuations of outcomes are then in terms of EQALYs rather than conventional ones. They may be related to costs in cost–value ratios that in theory indicate value for money of different interventions in a broader way than cost–utility ratios do.
An alternative to calculating EQALYs by using numbers like those in column 3 is to keep QALYs themselves untouched and instead practice context-dependent willingness to pay for QALYs. Consider columns 4–6 in Table 1. The figures in columns 4(a) and 4(b) follow from columns 2 to 3, respectively. The figures in column 5 presuppose an anchoring value for willingness to pay. If, for instance, the willingness to pay to save a life year in normal health is €100 000 EUR, the rest of the figures in column 5 follow by rescaling the figures in column 4(b) by a factor of 100 000. The column shows that willingness to pay increases much more than proportionally to the severity of the start point. As a consequence, the willingness to pay for a QALY increases with the severity of the start point (column 6).
This can be developed further. One may, in principle, construct a hierarchical set of priority classes that takes into account various equity concerns that society deems relevant in priority setting. For each class, a maximum societal willingness to pay for a QALY is decided, such that the higher the priority class, the higher is the willingness to pay. Any outcome in terms of QALYs is assigned to its appropriate class, which will be higher in the hierarchy the more the outcome has equity concerns counting in its favor. The cost of the QALY gain will then be compared to the maximum willingness to pay for a QALY in that class. For instance, QALYs gained in people with severe conditions will, all else equal, be placed in higher classes than QALYs gained in people with moderate conditions and thus justify higher costs. An approach of this kind is considered for implementation in the Netherlands, with a social willingness to pay for a QALY ranging from roughly €10 000 EUR to 80 000 depending on preintervention severity.
Although technically different, a scheme consisting of priority classes and context-dependent willingness to pay is in its actual content equivalent to a system in which QALYs themselves are weighted and compared to a uniform willingness to pay for a QALY. In both approaches, judgments need to be made regarding how much weight the QALYs in question deserve to be given. In one approach, the chosen weight is connected to willingness to pay by assignment to priority class, in the other approach the same weight is connected to the QALY gains themselves and thus indirectly to willingness to pay. preferences data that have been elicited by means of the person trade-off or other methods in order to determine equity weights for QALYs may thus also be relevant in determining the gradient of willingness to pay in a hierarchy of priority classes. To judge whether the cost per QALY of a given intervention is within the willingness to pay for QALYs in the priority class in question may thus be seen as a variant of CVA in the general sense of the term.
Alan Williams suggested in 1997 that QALYs should be assigned more value the more the beneficiaries’ expected health over the whole life time falls short of a normal amount of health (including longevity) over a whole life. This fair innings approach is essentially a proposal to include a societal concern for equity in the formal economic evaluation. The fair innings approach to weighting QALYs for equity may thus be seen as yet another variant of CVA in the general sense of that term.
Issues
Population preferences data to support CVA are presently not satisfactory. Data on what would be reasonable separate equity weights are almost nonexisting. This also applies to the fair innings approach. For the values in Table 1, column 3, the empirical basis in preferences measurements is substantial, but the values are the result of an informal meta-analysis of the relevant preferences literature conducted by one researcher. As noted in a review by Shah in 2009, other researchers could reach different conclusions.
Another current limitation is that Table 1 refers to health problems in terms of reduced mobility. This is because so much of the existing societal preferences data pertain to this particular dimension. To apply the numbers to other kinds of health problems, one needs to know where they belong on the severity scale of Table 1. This may be judged by judging the effect on quality of life of those other problems compared to the effects on quality of life of the various mobility problems indicated in the table. Alternatively one may regard columns 2 and 3 as roughly indicating the relationship in general between individual utilities and societal values. So for instance, if one has utilities from the multi-attribute utility instrument EQ-5D columns 2 and 3 may be used to roughly estimate corresponding societal values.
One common criticism of societal value numbers is that people’s responses to numerical preferences questions in mailed questionnaires are unreflective and unreliable. This is to some extent true. However, researchers have also collected preferences data in more high quality ways, for instance, in focus groups that discuss ethical issues carefully before each participant gives their responses to specific quantitative questions.
Finally, the idea of incorporating concerns for fairness in a numerical valuation model is controversial. Some researchers, for instance, Dolan and Olsen (2003), are concerned that such incorporation may overload the model and perhaps makes it more difficult to understand and less reliable. The alternative is to leave it to decision makers to take concerns for fairness into account informally when dealing with the results of cost-effectiveness analyses. This is an important practical issue for continued debate. It is also a theme for further research. At the end of the day, it is an empirical question whether decision makers feel helped or not by CVA, or feel more helped when provided with such analyses in addition to conventional cost-effectiveness analyses.
References:
- Dolan, P. and Olsen, J. A. (2003). Distributing health care: Economic and ethical issues. Oxford: Oxford University Press.
- Nord, E. (2001). Utilities from multi attribute utility instruments need correction. Annals of Medicine 33, 371–374.
- Nord, E., Pinto, J. L., Richardson, J., Menzel, P. and Ubel, P. (1999). Incorporating societal concerns for fairness in numerical valuations of health programs. Health Economics 8, 25–39.
- CVZ (2006). Pakketbeheer in de praktijk. Diemen: CVZ Rapport.
- Dolan, P. (1998). The measurement of individual utility and social welfare. Journal of Health Economics 17, 39–52.
- Nord, E. (1993). The trade-off between severity of illness and treatment effect in cost-value analysis of health care. Health Policy 24, 227–238.
- Nord, E. (1995). The person trade-off approach to valuing health care programs. Medical Decision Making 15, 201–208.
- Nord, E. (1999). Cost-value analysis in health care: Making sense out of QALYs. Cambridge: Cambridge University Press.
- Patrick, D., Bush, J. and Chen, M. (1973). Methods for measuring levels of wellbeing for a health status index. Health Services Research 8, 228–245.
- Shah, K. K. (2009). Severity of illness and priority setting in healthcare: A review of the literature. Health Policy 93, 77–84.
- Williams, A. (1988). Ethics and efficiency in the provision of health care. In Bell, J. M. and Mendus, S. (eds.) Philosophy and medical welfare, pp. 111–126. Cambridge: Cambridge University Press.
- Williams, A. (1997). Intergenerational equity: An exploration of the ‘fair innings’ argument. Health Economics 6, 117–132.