This article reviews econometric techniques and studies aimed at characterizing the market structure in the health sector. It focuses on the following issues: (1) the effect of competition on hospital quality, efficiency, and prices (if they are not fixed by a regulator); (2) differences in behavior that arise from different types of ownership status (non-profit vs. for-profit); (3) the extent to which demand for healthcare responds to quality; (4) the effect of mergers on cost savings, prices, and quality; and (5) the use of report cards and their impact on quality and providers’ incentive to select low severity patients.
These research questions have potentially important policy implications. Governments can encourage or discourage competition, or regulate it. They can favor one ownership status over another by introducing favorable tax regimes or by making a certain ownership mandatory. They may forbid or allow mergers through antitrust authorities and legislation. They can make report cards mandatory and publicly available.
The article focuses on key theoretical predictions, econometric strategy, empirical specification, and possible biases which may arise in testing such predictions. It also summarizes the main empirical findings for each theme. Moreover, because space is limited, the focus is on the hospital sector. Therefore, issues related to insurance markets, the pharmaceutical industry, provider labor markets, and the market of nursing and care homes are not investigated.
Effect Of Competition On Quality And Prices
The effect of competition on hospital behavior has been the subject of an extensive empirical literature. One key focus has been on testing the effect of competition on the quality of hospital care under two main institutional settings: (1) a fixedprice regime of the Diagnosis-Related Groups (DRG) type, where each hospital receives the same price to treat a patient with a given diagnosis (this is the case in Medicare in the USA and in many European countries); (2) a variable-price regime, where each hospital is free to set prices in a private competitive market (like in the USA) or prices are the result of a bargaining procedure between the purchaser of health services (a private or a public insurer) and the hospital.
Under the first regime, the standard prediction from economic theory is that higher competition should lead to higher quality. Because more competition makes the demand more responsive to a marginal increase in quality (and prices are fixed), hospitals have a stronger incentive to increase quality because it will attract a larger volume of patients and generate higher revenues. Under the second regime, the prediction is less clear-cut. More competition will also reduce price and the price-cost margin of each hospital, therefore, weakening the incentive to increase quality. This effect goes against the former one (in terms of higher demand responsiveness) so that competition may lead to an increase or a reduction in quality depending on the size of the two opposing effects. A similar ambiguous prediction is that if prices are easily contractible, whereas quality is not, more competition may lead to a large reduction in price at the expense of a large drop in quality.
The basic empirical strategy within a cross-sectional framework to test the above predictions is the following:
![]()
where qi is the quality provided by hospital i, ci is a measure of competition, and zi is a vector of control variables which also affect quality (e.g., volume of patients treated to control for learning-by-doing, dummies for different types of hospital, etc.).
There are different ways to measure competition in the health sector, which involves two main steps. The first step involves the definition of the catchment area of each hospital i, which gives the geographical area covering the potential competitors of hospital i (the area over which the hospitals ‘compete’). There are two main approaches to define catchment areas, which is based on: (1) a fixed radius, that draws a circle of 30 km (or an alternative distance of 20, 40 km) from the hospital; or a fixed travel time, that uses road maps to define a catchment area of 30 min travel time from the hospital (or alternative times: e.g., 20 or 40 min); (2) a variable radius technique, where the catchment area is based on the residence (as measured by their postcode) of the patients going to hospital i: the catchment area is defined, for example, on the residence of the 70% of patients living closest to the hospital (or an alternative proportion like 60% or 80% decided by the researcher). Note that not all patients are included (100%) because this would often imply that the catchment area of some hospitals includes the whole country, which is clearly unrealistic (there will often be at least one odd patient who traveled from far away or whose postcode is mistakenly recorded). Fixed radius models are simpler to compute but ignore the actual residence of the patients going to each hospital i. Variable radius models are more accurate because they address this problem but computationally more intensive. They also raise some endogeneity issues: hospitals with higher quality may have larger catchment areas. This is usually addressed by defining catchment areas on the basis of predicted rather than actual hospital choice. In practice, this involves estimating a multinomial logit model of a patient’s choice as a function of distance and other key regressors. Predicted market shares are then computed for each hospital and used to compute a competition measure.
Once the catchment area has been defined, the second step involves measuring the degree of competition within this area. The simplest way to measure competition is to count the number of hospitals (N) within the catchment area. Equivalently, the degree of concentration can be measured by 1/N. However, this measure has the disadvantage that it implicitly assumes that all hospitals have the same size: the market structure of a duopoly where each hospital has 50% of the market can be quite different from one where one hospital has 90% of the market and the other only 10% of the market. In the latter case, the market is less competitive than in the former one because one provider has a dominant position.
A modified version of the simple competition measure is the number of hospitals in the catchment area divided by the population of the catchment area (P): the measure is therefore N/P. For a given number of providers, areas with larger population effectively imply a lower degree of competition.
A second measure which takes into account the different size of each hospital is the widely used Herfindahl Index (HI) define the market share of each hospital i as si= yi/Yi, where yi is the number of patients treated by hospital i and Yi is the total number of patients treated within the catchment area of hospital i. The HI is given by the sum of the square of each market share:HIi=∑ni=1s2ij. Note that if all hospitals are identical, then the HIi is equal to 1/N, and the two measures (HI and the reciprocal of the number of hospitals) coincide. However, if the market shares are different then the two measures will differ. Suppose there are only two providers (N = 2) and that one hospital has 25% of the market whereas the other hospital has 75% of the market. Then, the HI is 1/ 4 + 9/16 = 0.81, which is larger than 0.5 (the HI when each provider has 50% of the market). The idea is that an asymmetric market is a less competitive one. As mentioned above, one problem with the computation of the HI based on ‘actual’ market shares is that these can be endogenous if, for example, hospitals with higher quality have larger market shares. To address this problem, the HI is often computed on the basis of predicted market shares (based on multinomial choice models).
Quality of care is the other key variable in the empirical model described in eqn [1]. It can be measured in a variety of ways. The most common one in recent literature makes use of mortality rates for (emergency) patients with acute myocardial infarction, more commonly known as ‘heart attack.’ These are considered to be a marker of the quality in the hospital. Other measures include total hospital mortality rates (adjusted by casemix), mortality rates for patients with stroke, pneumonia, heart failure, and other specific conditions, readmission rates within a month of discharge, and infection rates. In general there have been mixed findings in the literature on the effect of competition on quality with prices either fixed or variable and endogenously determined (see Gaynor and Town (2011) for a detailed review).
A similar approach to the one described in eqn [1] can be used to estimate the effect of competition on prices charged by hospitals by replacing the dependent variable qi with price pi. The empirical evidence is mainly from the USA, for the market not covered by Medicare and Medicaid (where prices are fixed), and confirms the expected negative effect between competition and prices. There is limited evidence from Europe where prices are regulated (and therefore fixed) in several publicly funded systems: Competition on price occurs mainly in the private sector, which is often small and data on prices are difficult to collect.
Ownership
A long-standing question in the health economics literature is whether profit and non-profit hospitals differ in their behavior. Most of the literature has focused on differences in quality and efficiency (with more recent studies focusing on quality). A fewer number of studies has focused on differential incentives to upcode (also known as DRG creep) and to select more profitable patients. Regarding quality, on one hand nonprofit hospitals may have an incentive to provide higher quality as they are under less pressure to increase profits; on the other hand, they are less responsive to demand variations. Standard economic theory also predicts non-profit hospitals to be less efficient because they cannot appropriate the financial surplus (or distribute it), they may have weaker incentive to keep costs down (or to be more efficient).
The typical basic regression for quality differences in a cross-sectional framework is the following one:
![]()
where qi is the quality provided by hospital i, si is a dummy variable for hospital status and is equal to 1 if hospital is for profit, and zi is a vector of control variables. Quality can be measured through mortality rates and adverse events such as surgical complications and medical errors. The empirical evidence from the USA is extensive but mixed. The recent review by Eggleston et al. (2008) find that whether for-profit hospitals provide lower or higher quality than non-profit ones depends on the specific context like the region, the data source, and the period of analysis. As an overall conclusion they suggest that as a whole quality seems to be lower among for-profit hospitals.
Some recent studies rely on a panel-data approach as opposed to a cross-sectional one, focusing on the effect of changes in ownership status over time (either from non-profit to for-profit or from for-profit to non-profit). This approach allows controlling for unobserved heterogeneity, i.e., the possibility that differences in quality between for-profit and non-profit hospitals simply reflect different location, catchment areas, casemix, or other unobservable variables. The econometric framework is therefore modified as follows:
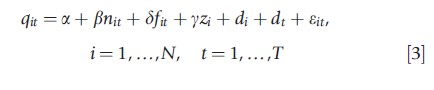
where nit is a dummy variable equal to 1 from the time a hospital converts from for-profit to non-profit, fit is a dummy variable equal to 1 from the time a hospital converts from non-profit to for-profit, di accounts for hospitals’ fixed effects to control for unobserved heterogeneity, and dt is a vector of year dummies to control for a time trend (e.g., health outcomes improve over time due to technology development).
Some literature finds that the change in status from nonprofit to for-profit reduces quality as measured by higher mortality rates for patients with heart attacks (deaths at 1, 6, and 12 months). One potential problem with such approach is that the switch from non-profit to for-profit status may not be random. For example, it can be argued that hospitals with declining quality are more likely to change status. To address this issue, authors have interacted the dummy variables on hospital conversion (f, n) with time dummies for the years preceding and following the conversion. This allows detecting whether the converting hospitals were already exhibiting a decline in quality before the conversion.
Others instead have addressed the issue by using a matching-estimator approach, for example, using propensity score matching to identify a control group which has a distribution of covariates that is in line with the distribution of the covariates in the treatment group. The estimation procedure first estimates the conditional probability of a hospital being for-profit for a given set of covariates (the propensity score) and then it matches each hospital (which switches from non-profit to for-profit) with a control hospital which has the closest propensity score. The covariates on which the hospitals are matched include hospital size, patient types, and financial state.
Most studies treat ownership as exogenous in eqn [2]. However, that may not necessarily be the case. For instance, patients may choose the type of hospital (for-profit vs. nonprofit) based on how severe they are and this may generate endogeneity: the quality of care (the dependent variable) affects who goes to a profit versus a non-profit hospital. One strategy is to use an instrumental-variable approach with instruments that include the distance to the closest non-profit hospital, and the difference in the distance between the closest non-profit hospital and the closest hospital (regardless of being for-profit or non-profit). Distances will affect the choice between a for-profit and a non-profit hospital, but should not be correlated with patients’ severity.
For-profit and non-profit hospitals may also differ in their incentive to upcode, i.e., to code patients in more remunerative fields. Payment systems of the DRG-type are complex and involve at least 500 different prices that depend on patient’s diagnosis and treatment. There is evidence in the USA that for-profit hospitals tend to upcode more than non-profit ones. Moreover, private hospitals, regardless of the for-profit or nonprofit status, may engage in cream-skimming of patients leaving the unprofitable ones to the public sector.
Regarding differences in efficiency, in his review of 317 published papers on frontier efficiency measurement, Hollingsworth (2008) concluded with some caution that public/non-profit hospitals tend to be more efficient than for-profit ones. The intuitive result that for-profit hospitals are more efficient than non-profit ones is therefore not confirmed in general. Efficiency is generally measured through parametric models, i.e., the estimation of stochastic frontiers, or nonparametric ones, i.e., data envelopment analysis. Some parametric studies focus on technical efficiency and derive efficiency scores by estimating the following production frontier model (within a cross-sectional framework):
![]()
where yi is typically the number of patients treated by hospital i (weighted by DRG weight to control for different casemix of the hospital), xi includes a range of inputs (number of beds, doctors, nurses), and zi includes a range of control variables (ideally quality); ei is hospital efficiency and ei is the error term. This model requires assumptions about the distribution of the efficiency term. The most common ones are the Half Normal, Truncated Normal, and Gamma. The efficiency scores derived following this methodology have been criticized for two main reasons: (1) they seldom control adequately for quality differences, so that efficiency scores may reflect higher quality; (2) they may be sensitive to outliers and the specific distributional assumptions of the efficiency term. The approach in eqn [4] has been extended to allow for multiple outputs (e.g., patients in different specialties, emergency vs. nonemergency patients, outpatients vs. inpatients). This can be pursued with a ‘Shepard distance function’ approach that ultimately involves using one output on the left-hand side (LHS) and the other ‘normalized’ outputs on the right-hand side (RHS) or a ‘polar coordinates’ approach using the Euclidian norm of the outputs on the LHS and polar coordinates angles on the RHS. These approaches can be criticized on the ground that output variables appear both on the LHS and the RHS of the regression model, possibly generating endogeneity.
Equation [4] focuses on technical efficiency. Other studies focus on allocative efficiency as well by estimating a cost frontier as opposed to a production frontier. In such a case the model is:
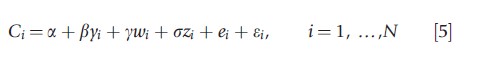
where Ci is total cost of hospital i, yi is (a vector of) output, wi is the (average) salary for different types of workers (doctors, nurses, administration), and zi is a range of control variables (quality, whether the hospital has teaching functions, etc.). This approach has also the advantage of accommodating multiple outputs without any additional assumptions.
As mentioned above, stochastic frontier techniques have been criticized for imposing distributional assumptions on the efficiency term and to rely on these to disentangle efficiency from noise. These assumptions can be relaxed by using panel data and estimating models of the following type:
where ei is a fixed effect at hospital level. The distributional assumptions are weaker. This approach still relies on having good control variables (e.g., on quality) so that ei can be interpreted as efficiency as opposed to a control for unobserved heterogeneity (where efficiency is only one determinant). Once the efficiency scores are obtained, the second step simply involves regressing the efficiency scores on hospital’s ownership type and other determinants.
Choice Models
At the heart of many health economic models is the assumption that demand of healthcare providers responds to quality. Providers with higher quality establish a good reputation and attract a larger number of patients. The estimation of the magnitude of the demand elasticity to quality has implications for policy design. For example, if hospital elasticity is high, policymakers will need to rely less on costly audits to ensure high standards of quality. Providers will have an incentive to provide high quality in order to attract patients and increase revenues. Similarly, one precondition for competition to encourage quality of care (already discussed above) is that demand responds to quality.
The assumption that providers’ demand responds to quality has been tested empirically by modeling patients’ choice of a hospital among a set of alternative ones. A common model is the conditional logit model which can be motivated within a random utility framework (McFadden,
1974). Suppose that the utility of patient j choosing hospital i is equal to Uji = βdji+yqj+εji , where dji is the distance between patient’s j residential address and hospital i address, qj is the quality of hospital j (e.g., mortality rates, readmission rates), and εji is the unobserved component of utility. If εji are independently and identically distributed, and follow type 1 extreme value distribution, then the probability of patient j choosing hospital i out of a total of N hospitals is given by:
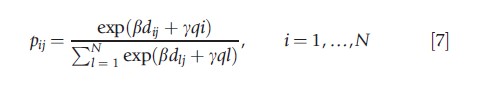
which is known as the conditional logit model.
The analysis is usually conducted for patients in need of a specific treatment (i.e., coronary bypass, percutaneous transluminal coronary angioplasty, kidney transplant, cataract surgery, hip replacement) or with a certain condition (i.e., acute myocardial infarction, pneumonia). A key regressor (or control variable) is the distance between the patient’s residence (postcode) and the hospital, which in all models turns out to be the main predictor of patients’ choice. The hospital choice is also affected by quality, as proxied by mortality rates, readmission rates, complication rates, and waiting times. Overall, this empirical literature finds that higher quality (as well as distance) increases the probability of choosing a provider, though the demand elasticities with respect to quality are small for most procedures and conditions.
To control for time-invariant unobserved heterogeneity, some studies estimate the conditional logit with panel data including hospital fixed-effects, therefore relying on variations in quality (mortality rates, readmission rates, waiting times) over time to identify the causal effect of quality on demand. One limitation of the conditional logit is that the relative probability of choosing any two hospitals is independent of any other alternative hospital (known as the independence of irrelevant alternatives). The logit models can also be extended to allow for latent classes (latent-class multinomial logit) and therefore allow the responsiveness of demand to quality to vary for different classes of patients (normally two), which are not observable to the researcher.
Mergers
A growing empirical literature has investigated the effect of mergers on efficiency (cost savings), prices, and quality. From a theoretical perspective, hospital mergers can lead to reductions in costs and an increase in efficiency through better management, exploitation of scale economies, and elimination of duplicate services. From an antitrust perspective, a merger also increases the market power of merging hospitals, which may allow them to increase prices at the expense of consumers. Therefore, one may expect price to reduce following a merger when the efficiency savings, which tend to reduce price, overcome the reduced competition effect, which tends to increase price. The lower degree of competition may also induce merged hospitals to skimp on quality because demand is less responsive to quality changes.
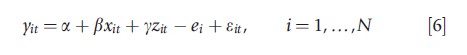
The basic econometric framework is the following:
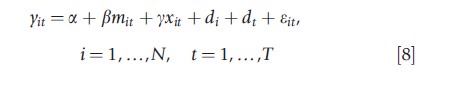
where yit is either cost, quality, or price, mit is a variable equal to 1 from the time the hospital has merged (and 0 otherwise), xit includes a range of controls. Note that for ‘merging’ hospitals, i refers to the sum of the costs of the two merged hospitals or the average price or quality in the merging hospitals.
One econometric problem with empirical studies evaluating the effects of mergers is that mergers may be endogenous: for example, a hospital merges because costs are high or quality is low (so that mit depends on yit). One way to account for such endogeneity is through the use of propensity score matching. This involves the estimation of a probit that models the probability of merging for each hospital i as a function of set of characteristics (the number of hospitals in the market, whether the hospital is for profit, non-profit, or a teaching hospital, etc.). Hospitals are then matched on the basis of predicted probabilities, i.e., the propensity to merge. Another potential econometric issue is that nonmerging hospitals may also react to mergers, for example, by also increasing prices or reducing quality, and may therefore not act as a good control group (Dafny, 2009). To address this issue, she uses as an instrument a variable which measures whether hospitals are colocated, the idea being that distance should be correlated with the probability of merging but not with the outcomes. ‘Regression to the mean’ may also be an issue if hospitals with high cost are followed by periods of low cost.
Most studies find that prices increase following a merger (Gaynor and Town, 2011). Dranove and Lindrooth (2003) find that in the USA mergers reduce hospital costs by approximately 14% during the 2–3 years following the merger. Previous studies have generally not found much evidence of cost savings. Ho and Hamilton (2000) find that mergers in California have no effect on the quality of care as measured by mortality rates for patients with heart attack and stroke, though readmission rates and early discharges for newborns increased in some cases. Gaynor Laudicella and Propper (2012) examine the impact of large number of mergers in England on a range of outcomes including financial performance, productivity, waiting times, and clinical quality. They find that mergers had no effect on quality.
Report Cards
Report cards are increasingly used in the healthcare sector to provide information on the quality of healthcare providers. They are intended mainly to help patients choosing the provider which matches better the needs of the patient, to improve choice and to encourage providers to increase quality in order to attract more patients. Typically, report cards provide mortality rates and readmission rates for specific conditions or procedures, coronary bypass being the most common one. In the USA, the State of New York was among the first to introduce such cards and for this reason has been intensively investigated in the empirical literature. Report cards can be provided at hospital or at doctor/surgeon level.
Because report cards have been introduced in different states at different times (and never introduced in some states), their effect is often investigated within a natural experiment set up with some states in the USA acting as the control group. There is evidence that market shares may be influenced by report cards with providers with better reports having larger market shares. One potential adverse effect of report cards is that they may encourage providers to treat (select) patients with lower severity who are at a lower risk of mortality and readmission. Dranove et al. (2003) provide evidence for such selection behavior, observing that the introduction of report cards was followed by a reduction in the average severity of illness, as measured by hospital utilization before admission, with the severity of patients in teaching hospitals instead increasing.
Conclusion
This article has reviewed econometric techniques and studies aimed at characterizing the market structure in the hospital sector. A range of econometric techniques have been employed to investigate the effect of competition, differences in behavior by ownership status, demand responses to quality, mergers, and report cards. Several studies make use of natural experiments exploiting exogenous shocks (e.g., in the evaluation of competition or report cards). If control groups are not well defined, propensity score matching has been used to account for self-selection and create pseudo control groups (e.g., in the case of conversion of for-profit to non-profit hospitals and mergers). When natural experiments are not available, endogeneity caused by unobserved heterogeneity or reverse causality is an issue. In such cases, panel data and instrumental variables have been used (e.g., in the evaluation of for-profit vs. non-profit hospitals). Conditional logit models have been usefully employed to estimate the responsiveness of hospital demand to quality.
As a whole these studies suggest that the market structure matters in the health sector, though not always in the expected way, and that the results may differ depending on country, outcome measure, and econometric methodology employed.
References:
- Dafny, L. (2009). Estimation and identification of merger effects: An application to hospital mergers. Journal of Law and Economics 52(3), 523–550.
- Dranove, D., Kessler, D., McLellan, M. and Satterthwaite, M. (2003). Is more information better? The effects of ‘report cards’ on health care providers. Journal of Political Economy 111(3), 555–588.
- Dranove, D. and Lindrooth, R. (2003). Hospital consolidation and costs: Another look at the evidence. Journal of Health Economics 22, 983–997.
- Eggleston, K., Shen, Y., Lau, J., Schmid, C. H. and Chan, J. (2008). Hospital ownership and quality of care: What explains the different results in the literature? Health Economics 17(12), 1345–1362.
- Gaynor, M. and Town, R. J. (2011). Competition in health care markets. In Pauly, M., McGuire, T. and Barros, P. P. (eds.) Handbook of health economics, chap. 9, pp 499–637. North-Holland: Elsevier.
- Gaynor, M., Laudicella, M., Propper, C. (2012). Can governments do it better? Merger mania and hospital outcomes in the English NHS, The Centre for Market and Public Organisation, 12/281, Department of Economics, University of Bristol.
- Ho, V. and Hamilton, B. H. (2000). Hospital mergers and acquisitions: Does market consolidation harm patients? Journal of Health Economics 19, 767–791.
- Hollingsworth, B. (2008). The measurement of efficiency and productivity of health care delivery. Health Economics 17, 1107–1128.
- McFadden, D. (1974). Conditional logit analysis of qualitative choice behaviour. In Zarembka, P. (ed.) Frontiers in econometrics, no. 4, pp 105–142. New York: Academic Press.