Introduction
Health inequality can be defined as variations in health status across individuals within a population. To compare inequalities between countries or over time periods, it may be, for example, interesting to know how much more healthy the healthier individuals are than the unhealthy individuals. However, it may be more interesting to know how health is distributed in relation to a socioeconomic variable. Any version of the concentration index (C) measures inequality in the distribution of a health variable in relation to a socioeconomic rank attached to each individual. Although there are other measures of socioeconomic-related health inequalities (e.g., epidemiologists frequently use absolute and relative range and the population attributable risk), health economists generally use the C. The popularity is probably due to the illustrative and intuitive interpretation. In addition, the C takes the whole population into account rather than only calculating differences between the extremes.
The remainder of this article is a short overview of the recent discussion on how to use different versions of the C to measure socioeconomic health inequalities. The next section defines and discusses the standard C and the related generalized C (GC). These indices are related to the (generalized) GINI coefficient, which is popular within the income inequality literature.
Herein, lie parts of the problem of using the C as a measure of health inequalities: health is rarely measured on the same scale as income. Measurement Properties of Health Variables there-fore considers the measurement properties of different health variables. Desirable Properties of Inequality Indices discusses desirable properties of an inequality index: the recent literature suggests that an index should be invariant to arbitrary transformations of the health variable. Recent Corrections of Concentration Index (a) presents the recent corrections of C that satisfies these properties and (b) discusses how one may relate to inequality indices for health variables that have different measurement properties from income. Guidelines for Practitioners compiles this literature into a guideline for practitioners and provides an illustration using European Survey of Health, Ageing and Retirement (SHARE)-data.
Concentration Index And The Generalized Concentration Index
Definitions
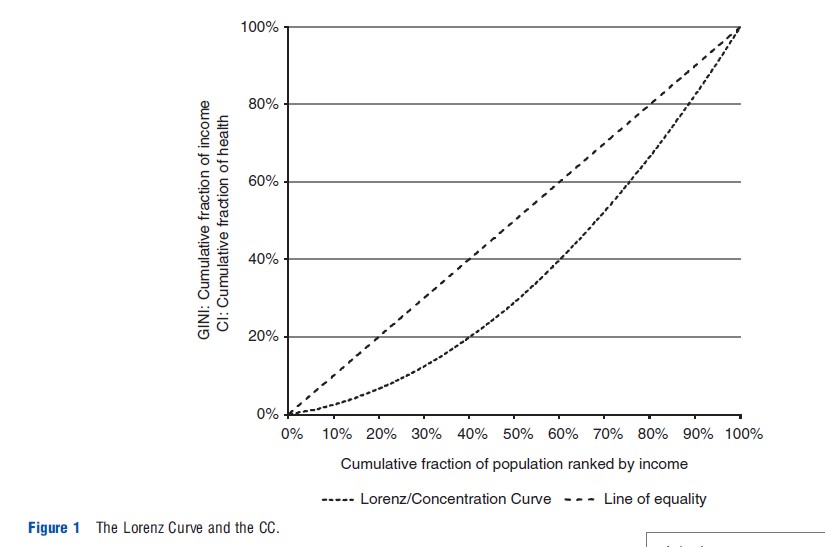
Just as the GINI coefficient is derived from the Lorenz curve, C is derived from the Concentration Curve (CC). Although the Lorenz curve plots the fraction of the total income concentrated in a fraction of the population ranked by income, CC plots the fraction of the total sum of a health variable that is concentrated in a fraction of the population ranked by a socioeconomic variable (e.g., income). For example, in Figure 1 the poorest 10% possess only 2.5% of the total health that is distributed within the society. As the line at 451 represents a perfectly equal distribution (i.e., the poorest 10% of the individuals possesses 10% of the total accumulated health), it is referred to as the line of equality (LE).
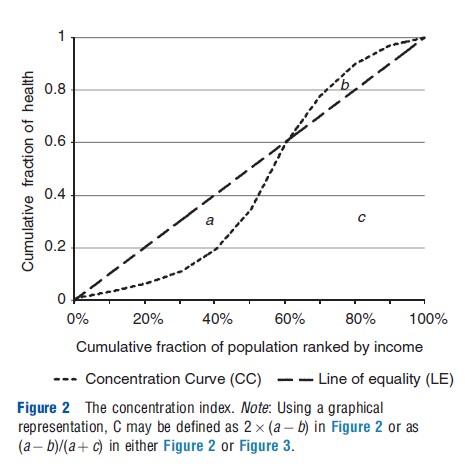
The GINI is equal to twice the area between LE and the Lorenz curve. However, as CC, in contrast to the Lorenz curve, can be both above and below LE, C is defined as twice the area below LE and above CC (i.e., area a in Figure 2) subtracted by twice the area above LE and below CC (i.e., area b). Equivalently, C may be expressed as a ratio between the area a-b and total area below the LE (i.e., a+c). Thus, C attains values between -1 and 1. A negative value suggests that the health variable is concentrated among the poor, whereas a positive value suggests that the health variable is concentrated among the rich. Thus, if the health variable is expressed positively in terms of health, a positive (negative) index suggests a pro-rich (pro-poor) distribution. The opposite applies if the health variable is expressed negatively in terms of ill-health. In the former case, C attains its maximum value when all health is concentrated to the richest individual. In the remainder of the article, this will be referred to as the most pro-rich state.
In a finite sample, the C may be formally expressed as:
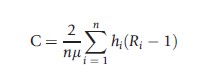
where n denotes the number of individuals, hi is health of individual i, μ is the mean of h, and Ri=n-1(i-0.5) is the fractional socioeconomic rank ranging from the poorest to the richest.
The related GC is analogously derived from the GCC, which plots the fraction of the mean of the health variable that is concentrated in a fraction of the population. As GC equals μC, it is not bounded between -1 and 1.
Absolute And Relative Value Judgment
C and GC are sensitive to different types of health changes. C is unaffected if health increases proportionally for all individuals, whereas GC is unaffected if health increases with an equal amount for all individuals. This difference relates to the clash in the income inequality literature between a relative and an absolute view of inequalities (e.g., Kolm, 1976). The degree of inequality can be preserved either if relative differences (ratios) or absolute differences remain the same. However, although income is always unbounded and measured on a ratio scale, health variables can be measured on different scales and can be either bounded or unbounded. It is therefore not appropriate to directly apply the value judgments from the income inequality literature to all health variables. Further elaborations on this question requires a discussion of the differences between health and income.
Measurement Properties Of Health Variables
Erreygers and van Ourti (2011a) categorize health variables by two dimensions: their measurement scale and boundedness. In principle, health variables can be measured on five different scales:
- Nominal, that is, a scale that allows for classifying, but not ordering, individuals (e.g., type of sickness). health care expenditures).
- Ordinal, that is, a scale that allows for ordering individuals but not measuring differences between them (e.g., self-assessed health graded from very bad to excellent).
- Cardinal, that is, the zero point is fixed arbitrary and does not have an intuitive interpretation of total absence, one may meaningfully calculate differences but not ratios (e.g., body temperature or Health Utility Indices (HUIs); The HUI is in the quality-adjusted life-years literature generally anchored between 0 and 1, representing being dead and perfect health respectively, and interpreted as if it was ratio scaled).
- Ratio scale, that is, the zero point corresponds to complete absence and ratios can be meaningfully measured (e.g., health care expenditures).
- Unique, that is, the zero point corresponds to complete absence, and it is not possible to scale the variable (e.g., number of general practitioner (GP)-visits).
Unless one circumvents the meaningless ordinal or nominal differences by projecting the health indicator on a cardinal or ratio scale (e.g., binary variables may always be interpreted as a ratio-scaled variable of average prevalence at the level of deciles/percentiles), one cannot use the C approach for nominal or ordinal scales. Therefore, the remainder of this article only considers health variables that are cardinal, ratio scaled, or unique.
The other dimension in which health variables and income may differ is that while there is no upper bound on income, health variables can be either unbounded or bounded. A bounded variable ranges from a theoretical lower bound hmin to a theoretical upper bound hmax. Therefore, one may – in contrast to unbounded variables – measure both attainments hi and shortfalls si of such a health variable (i.e., si=hmax-hi). This has crucial implications for the desirable properties and value judgments of the indices, discussed in the sections Desirable Properties of Inequality Indices and Value Judgment for Bounded Variables.
Desirable Properties Of Inequality Indices
The literature discusses several possibly desirable properties for health inequality indices. This section considers the most important ones. Although the transfer property and scale in- variance are relevant, and indisputably desirable, for all health variables, the mirror condition is only relevant for bounded variables.
The transfer property suggests that if health is (hypothetically) transferred from a poorer to a richer individual, then the inequality index becomes more pro-rich and vice versa.
Scale invariance suggests that the inequality index is unaffected by the scale of the variable (e.g., Erreygers and van Ourti, 2011a). For example, it is desirable that the measured degree of inequality is the same if health spending is measured in Euros or Dollars. For the same reason, it is desirable that the measured degree of inequality remains the same for different cardinal scales.
The mirror condition requires that the measured degree of inequalities is the same for shortfalls and attainments, i.e., the inequality index of attainments should be equal to the inequality index of shortfalls but have the opposite sign. As there is no general consensus of whether it is appropriate to measure inequality in shortfall or attainment, Clarke et al. (2002) highlight that the mirror condition may be desirable as it assures that the ranking between populations is the same irrespective of the chosen perspective. However, although the first two properties are indisputable, the mirror condition implies an implicit value judgment that is only desirable if one truly considers inequalities in shortfalls and in attainments to be two measures of the same concept.
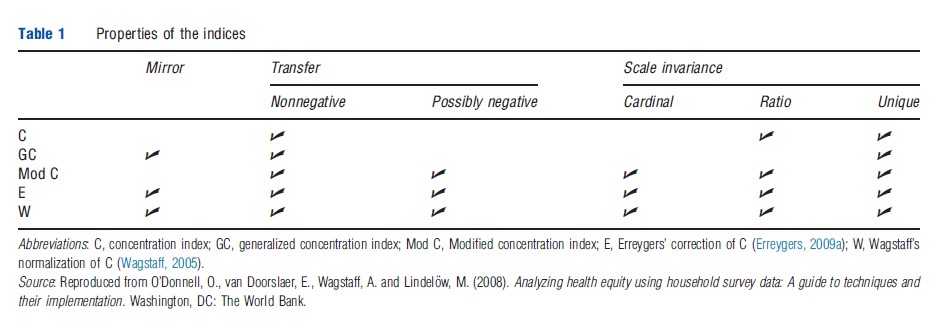
Both C and GC satisfy the transfer property as long as the health variable is nonnegative. Moreover, GC satisfies mirror but is not scale invariant for any measurement scale (other than for a unique scale). Conversely, C does not satisfy mirror but is scale invariant for ratio-scaled (but not cardinal) variables. As neither C nor GC satisfies all properties for all type of variables, further corrections of C have been proposed.
Recent Corrections Of Concentration Index
Definitions
This section presents and discusses three corrections that have recently been suggested. The first correction applies for cardinal variables (bounded or unbounded). Erreygers and van Ourti (2011a) suggest modifying the C as:
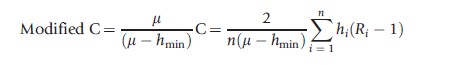
which is equivalent to computing C of a transformed health variable mi for which the minimum value are set to zero (i.e., mi=hi-hmin). Thus, this modification of C satisfies scale invariance for cardinal variables (which indirectly also implies that the index satisfies the transfer property even if hi attains negative values).
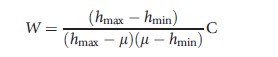
The other two corrections are specifically developed for bounded variables and satisfy the mirror condition as well as scale invariance for cardinal variables. Wagstaff (2005) corrects C as:
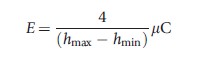
and Erreygers (2009a) corrects C as:
Although these three corrections of C satisfy scale invariance for cardinal variables, one still cannot directly apply the value judgments from the income inequality literature. Therefore, the next section reviews the recent discussion in the literature of how one may relate to these inequality indices for bounded (cardinal) variables (Table 1).
Value Judgments For Bounded Variables
In the ongoing discussion on inequality indices for bounded variables, Erreygers and van Ourti (2011a,b) advocate a redefinition of the relative and absolute value judgments, whereas Wagstaff (2005, 2009, 2011a) suggests an approach that compares how far the health distribution is from the most pro-rich state. This section presents the two views, starting with the former.
Scale invariance implies that, without changing the measured degree of inequalities, any bounded health variable can be represented by a standardized health variable hi* ranging from zero to one, that is, h*i=(hi-hmin)/(hmax-hmin). As differences in such a standardized variable always represent real health differences and are not an effect of changing the unit of measurement, Erreygers and van Ourti (2011a) define the value judgment for bounded variables based on inequality preserving changes of this variable. Still, the bounds of the variable act as constraints for some inequality preserving changes, that is, for some health distributions it is technically impossible to add an equal amount of health or to proportionally increase the health for all individuals without exceeding the upper bound of the variable. Erreygers and van Ourti (2011a) therefore redefine the value judgments so that an index embodies a specific value judgment if it is invariant to the corresponding inequality preserving change given that such a change is feasible.
Following this definition, Erreygers’ correction of C (E) captures an absolute value judgment; it is invariant to equal increments of the standardized health variable but not to proportional changes. However, for the relative value judgment, the transition to bounded variables is not as straightforward. As (the modified) C is invariant to equiproportionate changes of the standardized variable, it captures a relative value judgment. But C does not satisfy the mirror condition. In fact, Erreygers and van Ourti (2011a) show that it is impossible to combine the mirror condition with a relative value judgment.
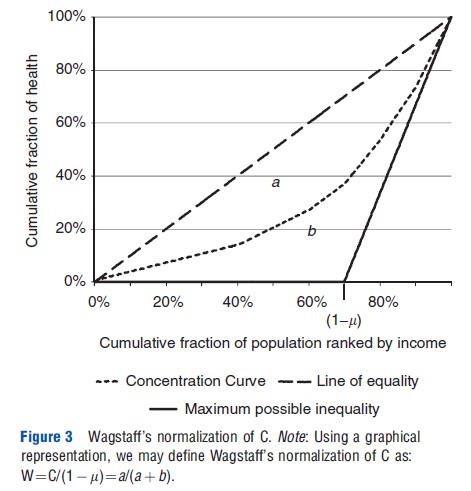
Wagstaff’s normalization of C (W) satisfies the mirror condition but captures neither a relative nor an absolute value judgment. For an equal increment, W increases if the mean of the standardized health variable is larger than 0.5 but decreases if the mean of the standardized health variable is smaller than 0.5. This seemingly strange and counterintuitive behavior is a result of Wagstaff’s solution to what he refers to as ‘the bounds issue.’ For bounded variables, the maximum and minimum value of C depends on the mean of the health variable; as C tends to one when only one single individual is in possession of all the health available in the society, the most pro-rich society cannot be reached unless there is only one individual in full health. This issue complicates comparisons between populations with different mean health. As a solution, Wagstaff normalizes C by the maximum value of the index (i.e., C of the most pro-rich state possible) given the level of health in the society (see Figure 3). Thus, in a society with a population of n individuals where the sum of h is equal to m, W attains the value of one when the richest m individuals have full health, whereas everyone else has no health. How a health change affects W reflects whether the society moves closer or further away from the most pro-rich state and, consequently, W may be interpreted as the answer to the question of how far the society is from that state (Wagstaff, 2009, 2011a).
Kjellsson and Gerdtham (2013) points out that C and E may also be interpreted as answering a similar question. However, the indices differ in their definition of the most prorich state; C attains its maximum value when the richest individual has all the health, and E attains its maximum value when only the upper half of the income distribution have full health and the lower half has no health.
Having reviewed the two approaches of how to measure health inequalities for variables of different measurement properties, the authors are now ready to compile the literature into a guideline for practitioners and follow the guideline in an empirical illustration.
Guidelines For Practitioners
Which Index To Use And When?
Simplifying the guidance from Erreygers and van Ourti (2011a), Table 2 summarizes the possible choices for a researcher or practitioner depending on the measurement scale and the boundedness of the health variable. To be eligible, the index has to satisfy transfer and scale invariance.
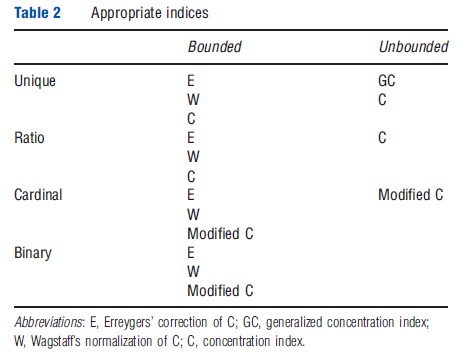
As scale invariance is not an issue for unbounded variables measured on a unique scale, one may apply either GC or C depending on the value judgment that one wants to impose. However, for unbounded variables that are either ratio scaled or cardinal one is constrained to apply a relative value judgment as (the modified) C is the only index that satisfies scale invariance.
For bounded variables, the choice boils down to the following three alternatives. First, one may choose to impose the mirror condition and apply an absolute value judgment by using E to answer the question of how far a society is from a state where the upper half of the income distribution has full health and the lower part has no health. Second, one may take the level of health in the society into account, but depart from a pure relative judgment, by using W to answer the question of how far a society is from a state where the richest m individuals have full health and everyone else has zero health. Third, one may choose to relax the mirror condition, not address the bounds-issue that Wagstaff highlights, and apply a relative value judgment, that is, using (the modified) C. However, applying a relative value judgment for bounded variables requires a decision of whether it is appropriate to measure inequalities in shortfalls or attainments.
The current advice in the literature is to accept that the relative value judgment and mirror condition are incompatible and either use a relative or an absolute value judgment (Erreygers and van Ourti, 2011a,b; Wagstaff, 2011b). Erreygers and van Ourti (2011a,b) advocate the attractiveness of the mirror condition and, thus, prefer E. They also stress that E satisfies two additional possibly desirable properties. The first property is as follows: if starting with an unequal health distribution and gradually decreasing the health of all individuals toward zero (i.e., in the limit all the health of individuals is zero, which implies a perfectly equal distribution), then E tends to zero. Neither C nor W shows this tendency. The second property is: if the health of a rich individual, i.e., an individual from the upper half of the income distribution, increases, then E always increases. Neither C nor W satisfies this property.
Conversely, Kjellsson and Gerdtham (2013) and Wagstaff (2009, 2011a) claim that these two properties are a result of the absolute value judgment. In a recent note, Wagstaff (2011b) also advocates abandoning the mirror property (and thereby also his own correction) for the relative value judgment. However, this literature provides no guidance on the choice between attainments and shortfalls. The bottom line of this discussion is that any index inevitably enforces a value judgment that the researcher needs to be aware of and explicitly consider.
Empirical Illustration
For illustrational purposes, this section uses three health variables from the second wave of SHARE to compute inequality indices that, depending on the measurement properties of the variable, satisfy scale invariance and the transfer property. All the three variables, a health index, out-of-pocket payments, and GP-visits, differ in respect of their measurement properties. For a comparison between these results and the work of the ECuity group (e.g., van Doorslaer and Koolman, 2004; van Doorslaer et al., 2004, 2006) horizontal inequity indices are calculated by indirectly standardizing for age, sex, and, when appropriate, health (see O’Donnell et al., 2008).
The health index is a cardinal variable ranging from 0 (being dead) to 1 (perfect health) and is similar to the HUI in van Doorslaer and Koolman (2004) but is specifically developed for the SHARE-data (Ju rges, 2007; Ju¨rges, 2005). Table 3 shows the value of the indices that satisfy scale invariance and the transfers property for bounded cardinal variables, i.e., (the modified) C of both shortfalls and attainments as well as W and E. As seen, the reranking of countries between the different inequality index is limited. Generally, the ranking varies less between the inequality indices when there is less variation in average health between countries. However, high average health generates a pattern where the ranking diverge into two groups: C of shortfalls and W; and C of attainments and E. A similar pattern would appear if one was to apply all four indices to 1996 European Community Household Panel in van Doorslaer and Koolman (2004). van Doorslaer and van Ourti (2011) confirm that the ranking is similar for C of attainments and E, whereas the authors encourage the reader to verify for oneself that using W or C of shortfalls will rerank countries in a similar manner as in their example. This reranking stresses on the importance of being aware of the value judgment that a particular index implies.
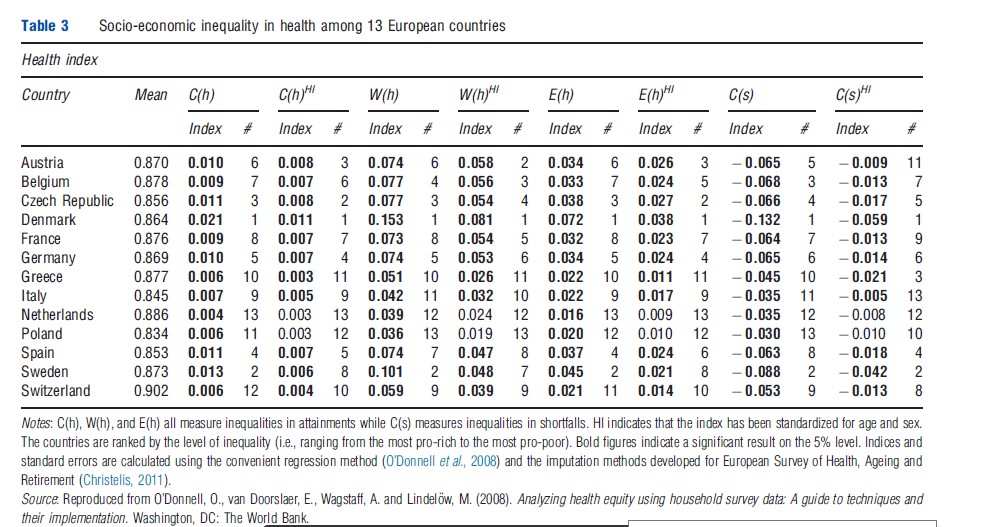
According to the nonstandardized indices, Denmark, Sweden, and the Czech Republic are ranked as the three most unequal countries, whereas the Netherlands, Poland, Greece, Switzerland, and Italy are the least unequal. However, when accounting for the demographics (i.e., standardize for age and sex), Sweden becomes relatively less unequal whereas Austria moves in the opposite direction. The positions of two of the extremes, Denmark and the Netherlands, are consistent with the findings in van Doorslaer and Koolman (2004).
As out-of-pocket payments, which is the sum of all the individuals’ out-of-pocket health spending (excluding insurance premiums) is a ratio-scaled variable, C is the only index that satisfies scale invariance and the transfer property. Therefore, one can only apply a relative value judgment. The results (Table 4) show that, except for Sweden, Poland, Greece, and the Czech Republic, the richer individuals pay a larger fraction of the out-of-pocket payment. The standardization increases the index for all countries, that is, the fraction the poorer individuals pay decreases when controlling for need (i.e., standardizing for age, sex, and the health index).
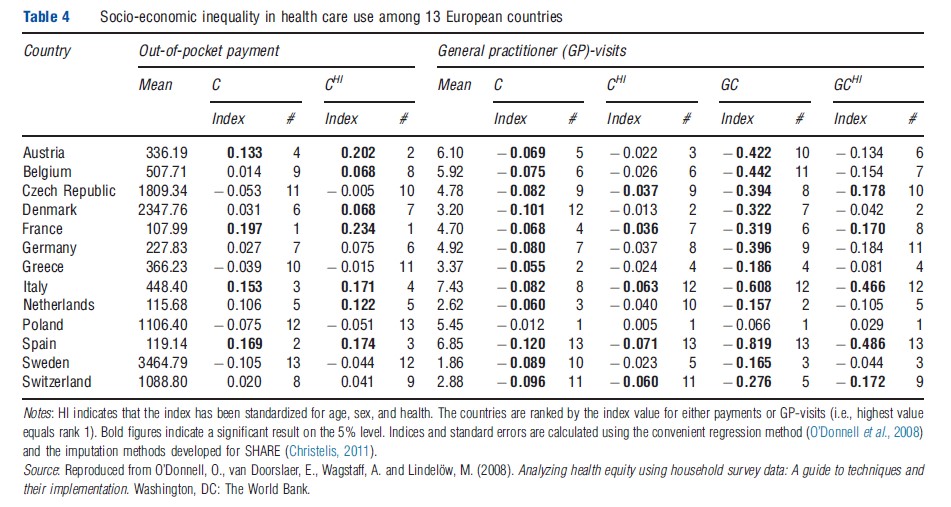
As the number of GP-visits is measured on a unique scale, it implies that both C and GC may be applied as both indices satisfy the necessary properties. The inequality indices of a utilization variable such as GP-visits measure inequality in access to care. When standardizing for age, sex, and health, the interpretation of the index is a measure of horizontal inequity. The overall tendency of the results (Table 4) is that the indices are negative even after controlling for the above, that is, there is a pro-poor discrimination of access to care. The notable differences between the rankings of C and GC again stress the importance of considering the value judgment. However, regardless of the value judgment, the pro-poor discrimination appears to be strongest in Spain and weakest in Poland. Although the results overall differ to some extent, the finding of Spain having the strongest propoor discrimination is in line with the work of the ECuity group (van Doorslaer et al., 2004, 2006).
Conclusion
This article reviews the recent literature on measuring socioeconomic health inequalities using the concentration index approach. The authors have briefly discussed when the different corrections of C are appropriate to use depending on the measurement properties of the health variable and value judgment one wants to impose. For an in-depth discussion of the topic see the articles in the further reading list.
References:
- Christelis, D. (2011). Imputation of missing data in waves 1 and 2 of SHARE. Available at: http://www.share-project.org/uploads/tx_sharepublications/WP_Series_01-2011_Christelis.pdf.
- Clarke, P., Gerdtham, U. G., Johannesson, M., Bingefors, K. and Smith, L. (2002). On the measurement of relative and absolute income-related health inequality. Social Science and Medicine 55, 1923–1928.
- van Doorslaer, E. and Koolman, X. (2004). Explaining the differences in incomerelated health inequalities across European countries. Health Economics 13, 609–628.
- van Doorslaer, E., Koolman, X. and Jones, A. M. (2004). Explaining income-related inequalities in doctor utilisation in Europe. Health Economics 13, 629–647.
- van Doorslaer, E., Masseria, C. and Koolman, X. (2006). Inequalities in access to medical care by income in developed countries. Canadian Medical Association Journal 174, 177–183.
- van Doorslaer, E. and van Ourti, T. (2011). Measuring inequality and inequity in health and health care. In Smith, P. and Glied, S. (eds.) The Oxford handbook of health economics, ch. 35, pp. 837–869. Oxford: Oxford University Press.
- Erreygers, G. (2009a). Correcting the concentration index. Journal of Health Economics 28, 504–515.
- Erreygers, G. and van Ourti, T. (2011a). Measuring socioeconomic inequality in health, health care and health financing by means of rank-dependent indices: A recipe for good practice. Journal of Health Economics, doi:10.1016/j.jhealeco.2011.04.004.
- Erreygers, G. and van Ourti, T. (2011b). Putting the cart before the horse. Comment on ‘‘The concentration index of a binary outcome revisited’’. Health Economics 20, 1161–1165.
- Jurges, H. (2005). Computing a comparable health index. In Borsch-Supan, A., Brugiavini, A., Jurges, H., et al. (eds.) Health, ageing and retirement in Europe – First results from the Survey of Health, Ageing and Retirement in
- Europe, p. 357. Mannheim: Mannheim Research Institute for the Economics of Aging (MEA).
- Jurges, H. (2007). True health vs response styles: Exploring cross-country differences in self-reported health. Health Economics 16, 163–178.
- Kjellsson, G. and Gerdtham, U.-G. (2013). On correcting the concentration index for binary variables. Journal of Health Economics. Available at: https://www.sciencedirect.com/science/article/pii/S0167629612001737.
- Kolm, S. C. (1976). Unequal inequalities II. Journal of Economic Theory 12, 416–442.
- O’Donnell, O., van Doorslaer, E., Wagstaff, A. and Lindelow, M. (2008). Analyzing health equity using household survey data: A guide to techniques and their implementation. Washington DC: The World Bank.
- Wagstaff, A. (2005). The bounds of the concentration index when the variable of interest is binary, with an application to immunization inequality. Health Economics 14, 429–432.
- Wagstaff, A. (2009). Correcting the concentration index: A comment. Journal of Health Economics 28, 516–520.
- Wagstaff, A. (2011a). The concentration index of binary outcome revisited. Health Economics 20, 1155–1160.
- Wagstaff, A. (2011b). Reply to Guido Erreygers and Tom Van Ourti’s comment on ‘‘The concentration index of a binary outcome revisited’’. Health Economics 20, 1166–1168.
- Erreygers, G. (2009b). Correcting the concentration index: A reply to Wagstaff. Journal of Health Economics 28, 521–524.