Abortion: Data And Demographics
Data
One of the biggest challenges in studying abortion is measuring its incidence. There was no national surveillance system for abortion until 1973, the year of the US Supreme Court decision in Roe versus Wade. In that year the Alan Guttmacher Institute (now the Guttmacher Institute) published its first national estimate of abortions by state. The Guttmacher survey of abortion providers was conducted annually from 1973 to 1988 with exception of 1983. After 1988, however, the periodicity of the survey was increased to every 4 years: 1992, 1996, 2000, 2004, and 2008.
The second major population-based source comes from the Centers for Disease Control and Prevention (CDC). The CDC collects data from state health departments and reports abortions by state, year, and several demographic factors: age, race, marital status, gestational age, type of procedure, parity, and previous induced abortions. There are two advantages to the CDC data. First, the availability of abortion by characteristics of the patient enable studies of policies based on age or gestational age. Second, data are available annually, whereas the Guttmacher Institute reports data periodically. As with data from the Guttmacher Institute, the CDC reports abortions by state of occurrence. In addition, the total number of abortions as reported by the CDC is approximately 15% lower than that reported by the Guttmacher Institute, and the degree of undercounting varies substantially by state. Further, not all states report abortions to the CDC or abortions cross-classified by characteristics of the patient; California and Florida are two populous and notable examples. Finally, the limited cross tabulation of the data prevents analyses by race or by gestational age.
Although the Guttmacher Institute’s periodic survey of abortion providers yields the most widely accepted estimate of the number of abortions, they have two important limitations for policy evaluations. First, abortions are tallied according to the state in which they occur and not according to the state in which a woman resides; and second, data are not available by age or any other characteristic at the state level. To overcome these limitations, Guttmacher researchers have applied the distribution of abortions by state and age as reported by the CDC to estimate the number of abortions by age. They also use information from the CDC on the proportion of abortions provided to nonresidents in a state along with other sources to estimate abortions by state of residence. Thus, it is important to remember that Guttmacher’s report of abortions by state of residence are an estimate and that they are unlikely to accurately measure cross-state travel by subpopulations in response to a change in policy. This is an important drawback, which is often ignored.
The third major source of data is state health departments. The CDC uses these same data in its surveillance reports. The major advantage of obtaining them directly from the state is that some states make available to researchers individual-level data on induced abortions, which allows for a more refined aggregation of data than what is available from the CDC. This can substantially improve the internal and external validity of an analysis (the ability to measure what one sets out to measure). The two major drawbacks to these data are similar to those stated above: completeness of reporting varies by state and residents who leave their state for an abortion are rarely counted by the state in which they reside. However, the latter drawback can be overcome if researchers are able to secure data from neighboring states.
The lack of data by state of residence is a major limitation. Studies of parental involvement (PI) laws and mandatory delay statutes based on data by state of occurrence will overestimate the decline in abortions associated with the laws, not only because residents leave the state for an abortion but also because nonresidents stop entering the state for an abortion. Studies of PI laws in the 1980s and the early 1990s were particularly vulnerable to this source of bias, as only 13 states had such laws in 1988. This made travel outside one’s state of residence feasible. More recent evaluations are less vulnerable to this source of bias because 35 states, including almost all states in the South and Midwest, now have PI laws. This makes traveling to a state without a law very challenging.
Other information on abortion is available from population-based surveys. The National Longitudinal Survey of Youth 1979 and 1997 ask respondents about previous abortions. The National Survey of Family Growth also queries respondents about past abortions. However, surveys grossly underestimate the number of abortions as many women do not report them. Moreover, the underreporting is not random: young, poor, and minority women appear to underreport more than other demographic groups. This has greatly limited the use of these data to evaluate policy.
Another source of data on the characteristics of women who have abortions comes from the Guttmacher Institute and its periodic survey of abortion patients. Using a sample of nationally representative abortion clinics, researchers survey patients waiting to have an abortion. The data are weighted to be nationally representative. In addition to data on age and race, they have information on income and insurance status.
Demographics
The abortion rate is defined as number of induced abortions per 1000 women of 15–44 years of age. In the US in 1973, there were 744 600 abortions and the rate was 16.3. As shown in Figure 1, the abortion rate rose after the decision in Roe versus Wade and peaked in 1981 at 29.3. It has fallen almost continuously since then. In 2008, there were 1 212 400 abortions and the rate stood at 19.6.
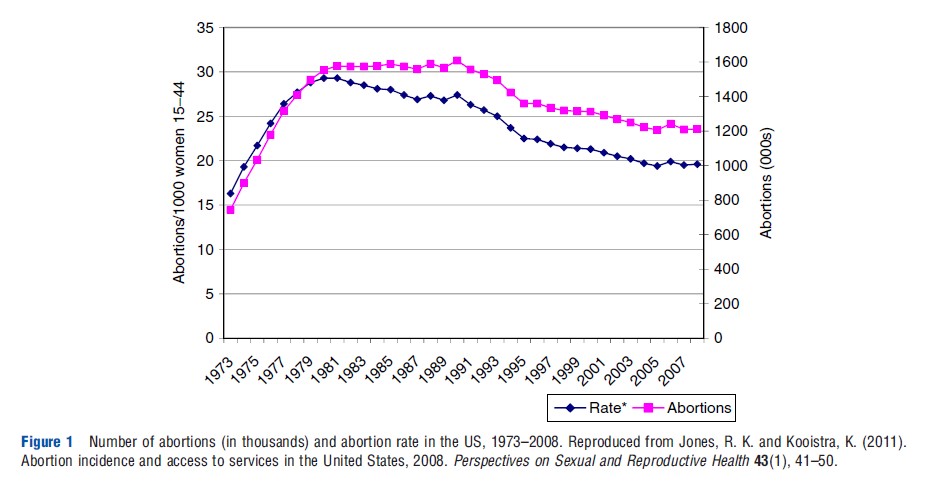
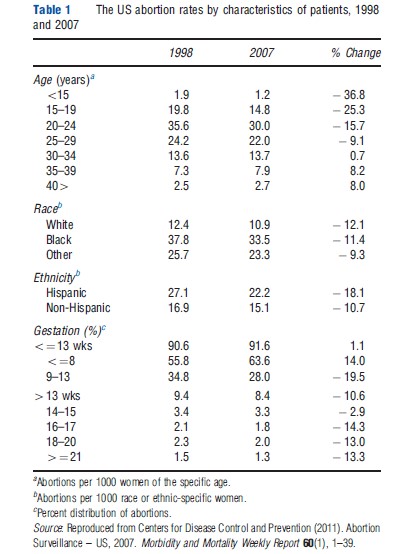
Table 1 shows the abortion rates by characteristics of the patients in 1998 and 2007 based on the CDCs annual surveillance of reporting states. The abortion rate was greatest for women of 20 to 24 years of age at 35.6 per 1000 in 1998 and 30.0 per 1000 in 2007. The teen abortion rates fell 25.3% over the same period from 19.8 to 14.8. The abortion rate of Blacks (37.8 in 1998) was more than 3 times that of Whites, and the rate for Hispanics more than 2 times that of Whites in both 1998 and 2007. Abortion rates have fallen for all three groups since 1998. More than 90% of abortions are performed at 13 weeks or less gestation. The percent of abortions less than or equal to 8 weeks gestation has risen from 55.8% in 1998 to 63.6% in 2007. This coincides with the growth in medical abortions which accounted for almost 14% of abortions among reporting states. The percent of abortions at or after 21 weeks gestation fell from 1.5% to 1.3% between 1998 and 2007.
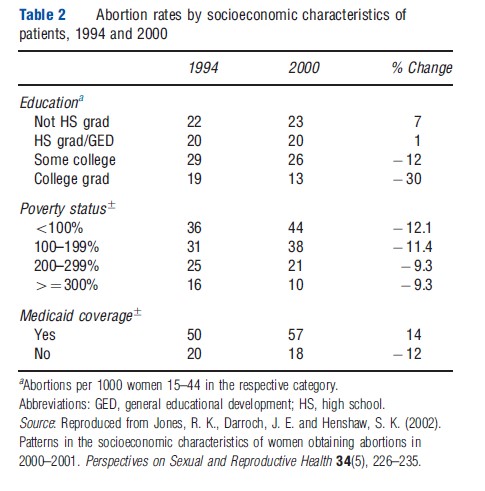
Abortions by education, poverty status, and insurance coverage are shown in Table 2. These estimates are from the Guttmacher Institute’s periodic survey of abortion patients and are weighted to be nationally representative. Several figures stand out. First, differences by poverty status are striking. In the year 2000, women from families with less than 100% of the federal poverty level in that year have more than four times the abortion rate of women from families at 300% or more of the federal poverty level. The abortion rate of women with Medicaid coverage, at 57 per 1000 Medicaid recipients, are even higher than those of women in poverty. However, differences in abortion rates by education, a permanent measure of human capital, are much more muted.
In sum, age, race, and income are the three most important correlates of abortion rates in the US. They suggest that young, Black women in poverty are at much higher risk of an unintended pregnancy than their older, White counterparts. The figures also underscore the importance of abortion as a method of fertility control among young, poor, and minority women. If the elasticity of demand for abortion services is greater among less advantaged groups, then policies that raise the cost or lessen the availability of abortion services are likely to impact these groups more than women whose rate of unintended pregnancy is less.